Hawaiian vs Immigrants from Ireland Householder Income Ages 25 - 44 years
COMPARE
Hawaiian
Immigrants from Ireland
Householder Income Ages 25 - 44 years
Householder Income Ages 25 - 44 years Comparison
Hawaiians
Immigrants from Ireland
$90,722
HOUSEHOLDER INCOME AGES 25 - 44 YEARS
10.6/ 100
METRIC RATING
212th/ 347
METRIC RANK
$120,333
HOUSEHOLDER INCOME AGES 25 - 44 YEARS
100.0/ 100
METRIC RATING
7th/ 347
METRIC RANK
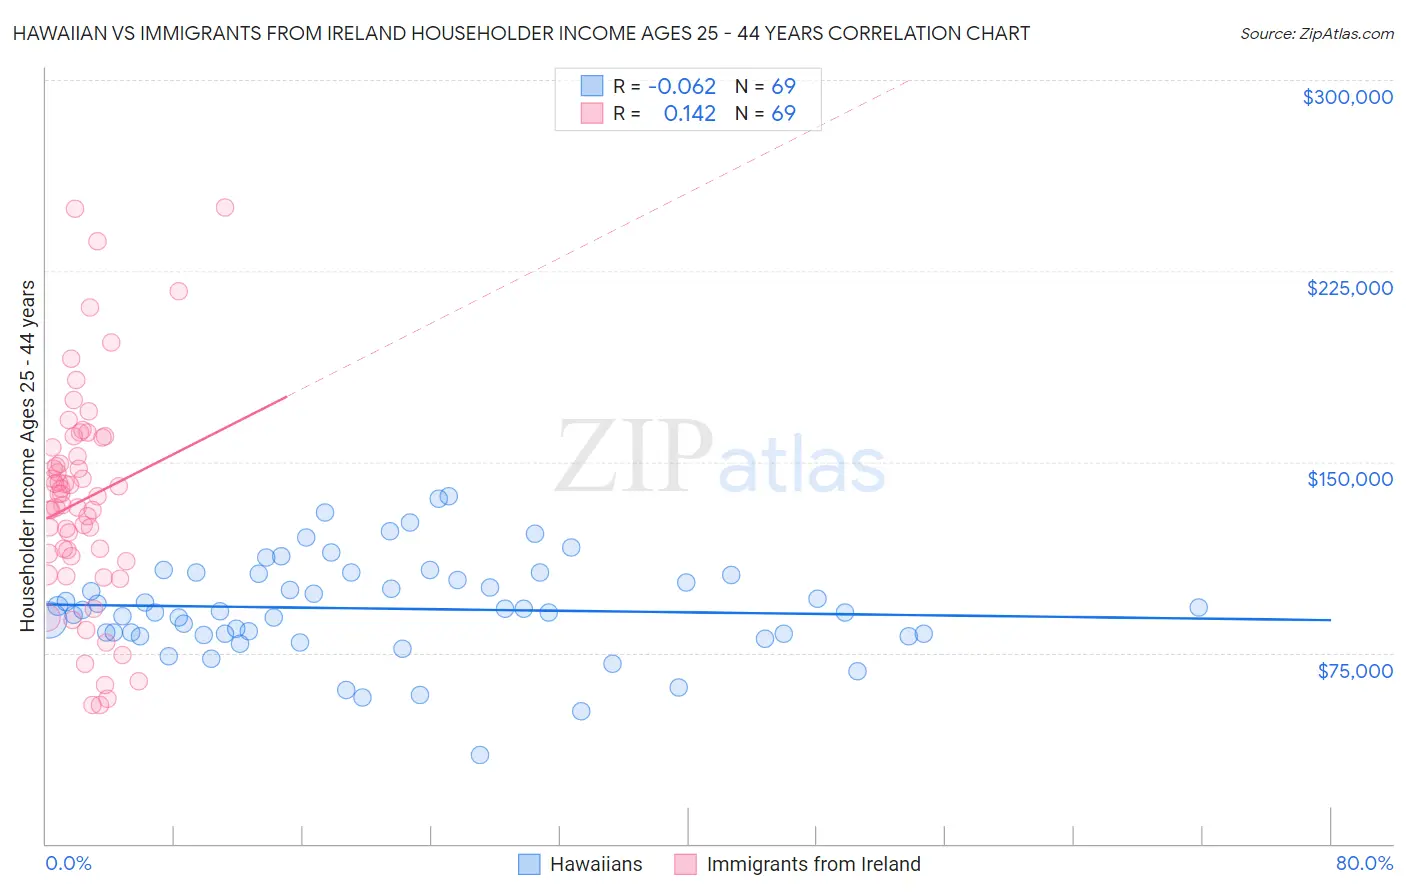
Hawaiian vs Immigrants from Ireland Householder Income Ages 25 - 44 years Correlation Chart
The statistical analysis conducted on geographies consisting of 326,791,638 people shows a slight negative correlation between the proportion of Hawaiians and household income with householder between the ages 25 and 44 in the United States with a correlation coefficient (R) of -0.062 and weighted average of $90,722. Similarly, the statistical analysis conducted on geographies consisting of 240,342,740 people shows a poor positive correlation between the proportion of Immigrants from Ireland and household income with householder between the ages 25 and 44 in the United States with a correlation coefficient (R) of 0.142 and weighted average of $120,333, a difference of 32.6%.
Householder Income Ages 25 - 44 years Correlation Summary
| Measurement | Hawaiian | Immigrants from Ireland |
| Minimum | $34,643 | $54,479 |
| Maximum | $136,607 | $250,001 |
| Range | $101,964 | $195,522 |
| Mean | $92,360 | $134,959 |
| Median | $91,260 | $136,656 |
| Interquartile 25% (IQ1) | $82,156 | $112,137 |
| Interquartile 75% (IQ3) | $105,819 | $157,677 |
| Interquartile Range (IQR) | $23,663 | $45,540 |
| Standard Deviation (Sample) | $19,487 | $42,676 |
| Standard Deviation (Population) | $19,345 | $42,366 |
Similar Demographics by Householder Income Ages 25 - 44 years
Demographics Similar to Hawaiians by Householder Income Ages 25 - 44 years
In terms of householder income ages 25 - 44 years, the demographic groups most similar to Hawaiians are Immigrants from Kenya ($90,767, a difference of 0.050%), Iraqi ($90,764, a difference of 0.050%), Immigrants from Bangladesh ($90,448, a difference of 0.30%), Immigrants from Africa ($90,372, a difference of 0.39%), and Immigrants from Uruguay ($91,171, a difference of 0.49%).
| Demographics | Rating | Rank | Householder Income Ages 25 - 44 years |
| Immigrants | Eastern Africa | 15.2 /100 | #205 | Poor $91,458 |
| Aleuts | 14.5 /100 | #206 | Poor $91,370 |
| Yugoslavians | 14.5 /100 | #207 | Poor $91,368 |
| Immigrants | Thailand | 14.3 /100 | #208 | Poor $91,337 |
| Immigrants | Uruguay | 13.2 /100 | #209 | Poor $91,171 |
| Immigrants | Kenya | 10.9 /100 | #210 | Poor $90,767 |
| Iraqis | 10.8 /100 | #211 | Poor $90,764 |
| Hawaiians | 10.6 /100 | #212 | Poor $90,722 |
| Immigrants | Bangladesh | 9.3 /100 | #213 | Tragic $90,448 |
| Immigrants | Africa | 8.9 /100 | #214 | Tragic $90,372 |
| Panamanians | 8.1 /100 | #215 | Tragic $90,193 |
| Ghanaians | 7.9 /100 | #216 | Tragic $90,137 |
| Scotch-Irish | 7.3 /100 | #217 | Tragic $89,969 |
| Guyanese | 7.1 /100 | #218 | Tragic $89,940 |
| Delaware | 6.9 /100 | #219 | Tragic $89,876 |
Demographics Similar to Immigrants from Ireland by Householder Income Ages 25 - 44 years
In terms of householder income ages 25 - 44 years, the demographic groups most similar to Immigrants from Ireland are Iranian ($120,292, a difference of 0.030%), Immigrants from China ($119,756, a difference of 0.48%), Indian (Asian) ($119,496, a difference of 0.70%), Okinawan ($119,349, a difference of 0.82%), and Immigrants from Iran ($119,204, a difference of 0.95%).
| Demographics | Rating | Rank | Householder Income Ages 25 - 44 years |
| Immigrants | Taiwan | 100.0 /100 | #1 | Exceptional $129,122 |
| Filipinos | 100.0 /100 | #2 | Exceptional $128,723 |
| Immigrants | Hong Kong | 100.0 /100 | #3 | Exceptional $128,140 |
| Immigrants | Singapore | 100.0 /100 | #4 | Exceptional $124,429 |
| Immigrants | India | 100.0 /100 | #5 | Exceptional $124,238 |
| Thais | 100.0 /100 | #6 | Exceptional $121,778 |
| Immigrants | Ireland | 100.0 /100 | #7 | Exceptional $120,333 |
| Iranians | 100.0 /100 | #8 | Exceptional $120,292 |
| Immigrants | China | 100.0 /100 | #9 | Exceptional $119,756 |
| Indians (Asian) | 100.0 /100 | #10 | Exceptional $119,496 |
| Okinawans | 100.0 /100 | #11 | Exceptional $119,349 |
| Immigrants | Iran | 100.0 /100 | #12 | Exceptional $119,204 |
| Immigrants | Eastern Asia | 100.0 /100 | #13 | Exceptional $118,056 |
| Immigrants | Israel | 100.0 /100 | #14 | Exceptional $117,219 |
| Immigrants | South Central Asia | 100.0 /100 | #15 | Exceptional $116,626 |