Haitian vs Immigrants from Yemen Median Earnings
COMPARE
Haitian
Immigrants from Yemen
Median Earnings
Median Earnings Comparison
Haitians
Immigrants from Yemen
$40,918
MEDIAN EARNINGS
0.0/ 100
METRIC RATING
303rd/ 347
METRIC RANK
$39,540
MEDIAN EARNINGS
0.0/ 100
METRIC RATING
326th/ 347
METRIC RANK
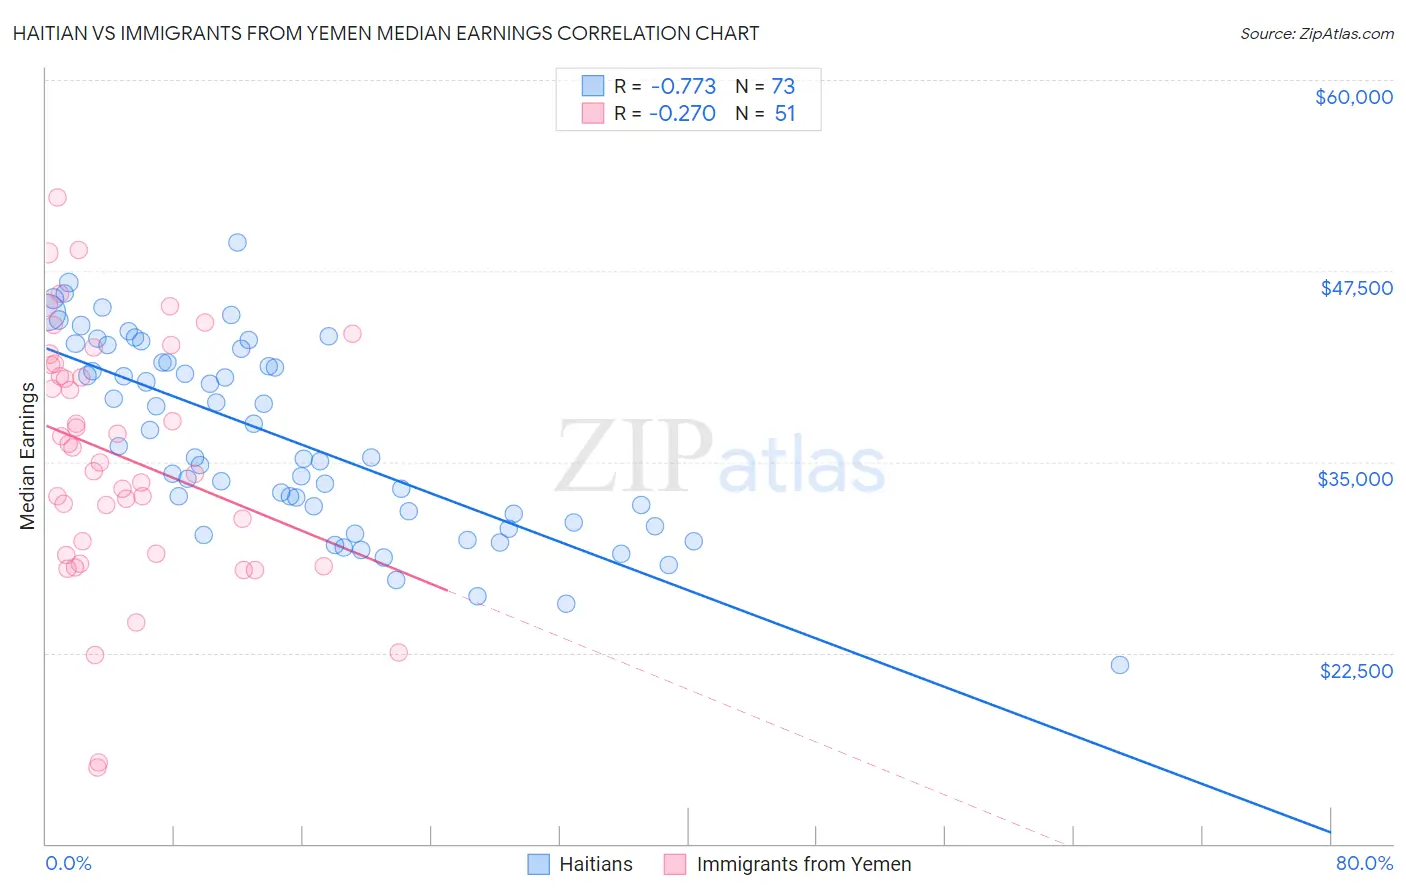
Haitian vs Immigrants from Yemen Median Earnings Correlation Chart
The statistical analysis conducted on geographies consisting of 288,009,020 people shows a strong negative correlation between the proportion of Haitians and median earnings in the United States with a correlation coefficient (R) of -0.773 and weighted average of $40,918. Similarly, the statistical analysis conducted on geographies consisting of 82,433,611 people shows a weak negative correlation between the proportion of Immigrants from Yemen and median earnings in the United States with a correlation coefficient (R) of -0.270 and weighted average of $39,540, a difference of 3.5%.
Median Earnings Correlation Summary
| Measurement | Haitian | Immigrants from Yemen |
| Minimum | $21,741 | $15,000 |
| Maximum | $49,370 | $52,299 |
| Range | $27,629 | $37,299 |
| Mean | $36,539 | $35,429 |
| Median | $35,319 | $35,934 |
| Interquartile 25% (IQ1) | $31,314 | $29,005 |
| Interquartile 75% (IQ3) | $41,959 | $41,449 |
| Interquartile Range (IQR) | $10,645 | $12,444 |
| Standard Deviation (Sample) | $6,179 | $8,118 |
| Standard Deviation (Population) | $6,136 | $8,038 |
Similar Demographics by Median Earnings
Demographics Similar to Haitians by Median Earnings
In terms of median earnings, the demographic groups most similar to Haitians are Shoshone ($40,932, a difference of 0.030%), Immigrants from Guatemala ($40,851, a difference of 0.16%), Ute ($41,051, a difference of 0.32%), Immigrants from Latin America ($41,049, a difference of 0.32%), and Immigrants from Caribbean ($41,119, a difference of 0.49%).
| Demographics | Rating | Rank | Median Earnings |
| Cherokee | 0.1 /100 | #296 | Tragic $41,252 |
| Guatemalans | 0.1 /100 | #297 | Tragic $41,205 |
| Immigrants | Micronesia | 0.1 /100 | #298 | Tragic $41,133 |
| Immigrants | Caribbean | 0.1 /100 | #299 | Tragic $41,119 |
| Ute | 0.1 /100 | #300 | Tragic $41,051 |
| Immigrants | Latin America | 0.1 /100 | #301 | Tragic $41,049 |
| Shoshone | 0.0 /100 | #302 | Tragic $40,932 |
| Haitians | 0.0 /100 | #303 | Tragic $40,918 |
| Immigrants | Guatemala | 0.0 /100 | #304 | Tragic $40,851 |
| Chickasaw | 0.0 /100 | #305 | Tragic $40,672 |
| Yaqui | 0.0 /100 | #306 | Tragic $40,647 |
| Hondurans | 0.0 /100 | #307 | Tragic $40,638 |
| Cubans | 0.0 /100 | #308 | Tragic $40,619 |
| Immigrants | Haiti | 0.0 /100 | #309 | Tragic $40,550 |
| Apache | 0.0 /100 | #310 | Tragic $40,388 |
Demographics Similar to Immigrants from Yemen by Median Earnings
In terms of median earnings, the demographic groups most similar to Immigrants from Yemen are Yuman ($39,523, a difference of 0.040%), Sioux ($39,448, a difference of 0.23%), Creek ($39,648, a difference of 0.27%), Ottawa ($39,721, a difference of 0.46%), and Bahamian ($39,735, a difference of 0.49%).
| Demographics | Rating | Rank | Median Earnings |
| Blacks/African Americans | 0.0 /100 | #319 | Tragic $40,085 |
| Immigrants | Bahamas | 0.0 /100 | #320 | Tragic $39,861 |
| Mexicans | 0.0 /100 | #321 | Tragic $39,834 |
| Immigrants | Central America | 0.0 /100 | #322 | Tragic $39,762 |
| Bahamians | 0.0 /100 | #323 | Tragic $39,735 |
| Ottawa | 0.0 /100 | #324 | Tragic $39,721 |
| Creek | 0.0 /100 | #325 | Tragic $39,648 |
| Immigrants | Yemen | 0.0 /100 | #326 | Tragic $39,540 |
| Yuman | 0.0 /100 | #327 | Tragic $39,523 |
| Sioux | 0.0 /100 | #328 | Tragic $39,448 |
| Kiowa | 0.0 /100 | #329 | Tragic $39,232 |
| Immigrants | Congo | 0.0 /100 | #330 | Tragic $39,169 |
| Immigrants | Mexico | 0.0 /100 | #331 | Tragic $39,114 |
| Yakama | 0.0 /100 | #332 | Tragic $39,107 |
| Houma | 0.0 /100 | #333 | Tragic $38,949 |