Guyanese vs Nepalese Median Household Income
COMPARE
Guyanese
Nepalese
Median Household Income
Median Household Income Comparison
Guyanese
Nepalese
$80,734
MEDIAN HOUSEHOLD INCOME
5.7/ 100
METRIC RATING
227th/ 347
METRIC RANK
$82,410
MEDIAN HOUSEHOLD INCOME
15.1/ 100
METRIC RATING
213th/ 347
METRIC RANK
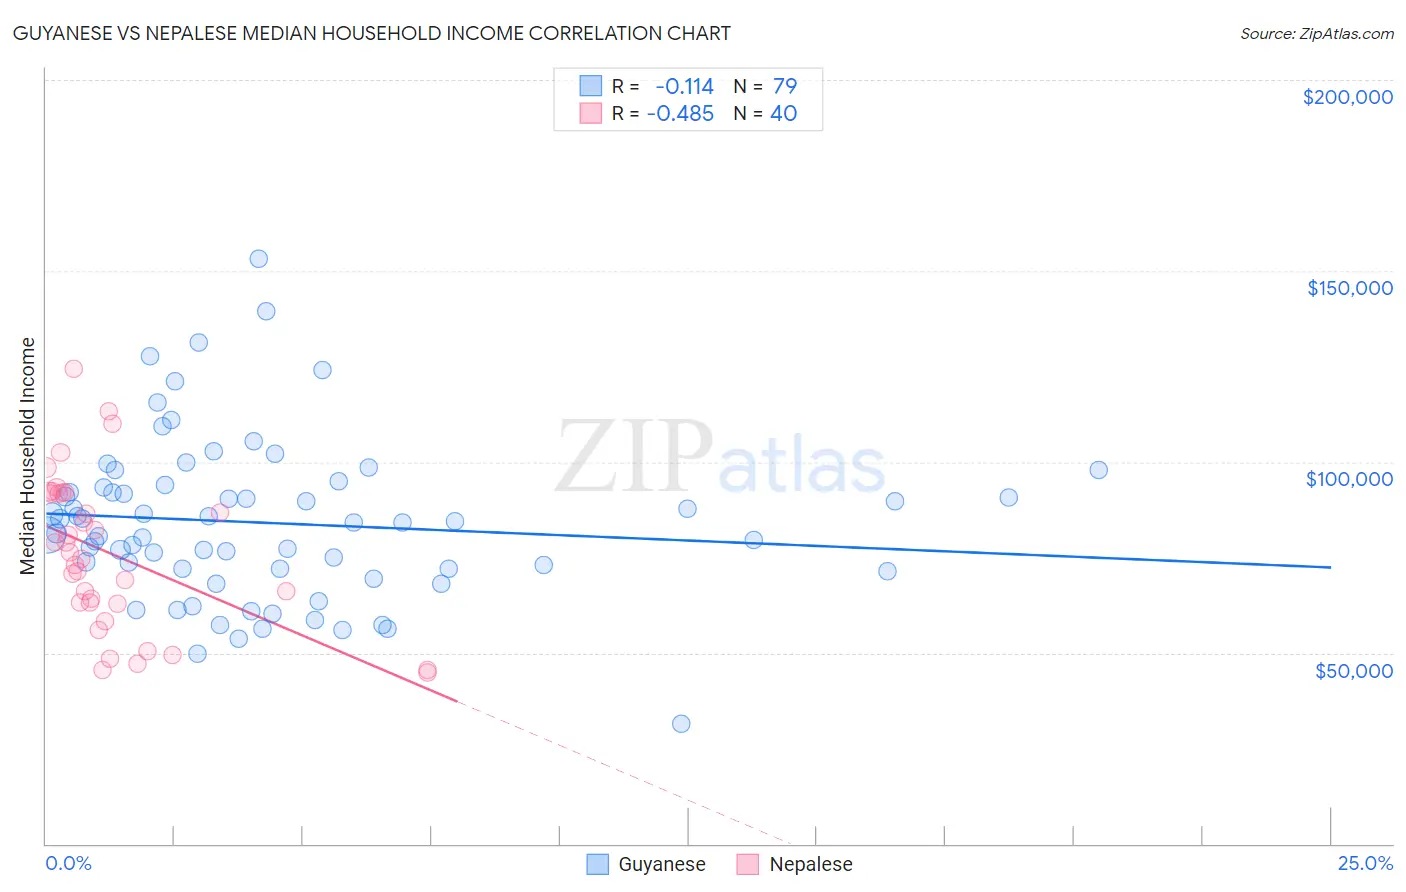
Guyanese vs Nepalese Median Household Income Correlation Chart
The statistical analysis conducted on geographies consisting of 176,770,411 people shows a poor negative correlation between the proportion of Guyanese and median household income in the United States with a correlation coefficient (R) of -0.114 and weighted average of $80,734. Similarly, the statistical analysis conducted on geographies consisting of 24,521,755 people shows a moderate negative correlation between the proportion of Nepalese and median household income in the United States with a correlation coefficient (R) of -0.485 and weighted average of $82,410, a difference of 2.1%.
Median Household Income Correlation Summary
| Measurement | Guyanese | Nepalese |
| Minimum | $31,571 | $45,000 |
| Maximum | $153,152 | $124,273 |
| Range | $121,581 | $79,273 |
| Mean | $83,976 | $75,935 |
| Median | $84,085 | $75,316 |
| Interquartile 25% (IQ1) | $71,864 | $63,001 |
| Interquartile 75% (IQ3) | $93,235 | $91,848 |
| Interquartile Range (IQR) | $21,371 | $28,847 |
| Standard Deviation (Sample) | $21,109 | $20,077 |
| Standard Deviation (Population) | $20,975 | $19,825 |
Demographics Similar to Guyanese and Nepalese by Median Household Income
In terms of median household income, the demographic groups most similar to Guyanese are Immigrants from Bangladesh ($80,722, a difference of 0.010%), Immigrants from Panama ($80,873, a difference of 0.17%), Delaware ($80,527, a difference of 0.26%), Scotch-Irish ($80,972, a difference of 0.29%), and Malaysian ($81,064, a difference of 0.41%). Similarly, the demographic groups most similar to Nepalese are Venezuelan ($82,432, a difference of 0.030%), Salvadoran ($82,449, a difference of 0.050%), Panamanian ($82,272, a difference of 0.17%), Immigrants from Uruguay ($82,560, a difference of 0.18%), and Vietnamese ($82,248, a difference of 0.20%).
| Demographics | Rating | Rank | Median Household Income |
| Immigrants | Uruguay | 16.4 /100 | #210 | Poor $82,560 |
| Salvadorans | 15.4 /100 | #211 | Poor $82,449 |
| Venezuelans | 15.3 /100 | #212 | Poor $82,432 |
| Nepalese | 15.1 /100 | #213 | Poor $82,410 |
| Panamanians | 14.0 /100 | #214 | Poor $82,272 |
| Vietnamese | 13.8 /100 | #215 | Poor $82,248 |
| Yugoslavians | 13.3 /100 | #216 | Poor $82,186 |
| Ecuadorians | 12.5 /100 | #217 | Poor $82,070 |
| Whites/Caucasians | 12.2 /100 | #218 | Poor $82,029 |
| Nigerians | 10.3 /100 | #219 | Poor $81,725 |
| Immigrants | Venezuela | 9.0 /100 | #220 | Tragic $81,506 |
| Immigrants | Ghana | 9.0 /100 | #221 | Tragic $81,489 |
| Immigrants | Nigeria | 7.7 /100 | #222 | Tragic $81,236 |
| Immigrants | El Salvador | 7.6 /100 | #223 | Tragic $81,213 |
| Malaysians | 7.0 /100 | #224 | Tragic $81,064 |
| Scotch-Irish | 6.6 /100 | #225 | Tragic $80,972 |
| Immigrants | Panama | 6.2 /100 | #226 | Tragic $80,873 |
| Guyanese | 5.7 /100 | #227 | Tragic $80,734 |
| Immigrants | Bangladesh | 5.7 /100 | #228 | Tragic $80,722 |
| Delaware | 5.0 /100 | #229 | Tragic $80,527 |
| Bermudans | 4.7 /100 | #230 | Tragic $80,406 |