Guyanese vs Immigrants from Bolivia Per Capita Income
COMPARE
Guyanese
Immigrants from Bolivia
Per Capita Income
Per Capita Income Comparison
Guyanese
Immigrants from Bolivia
$40,949
PER CAPITA INCOME
4.5/ 100
METRIC RATING
232nd/ 347
METRIC RANK
$48,970
PER CAPITA INCOME
99.7/ 100
METRIC RATING
75th/ 347
METRIC RANK
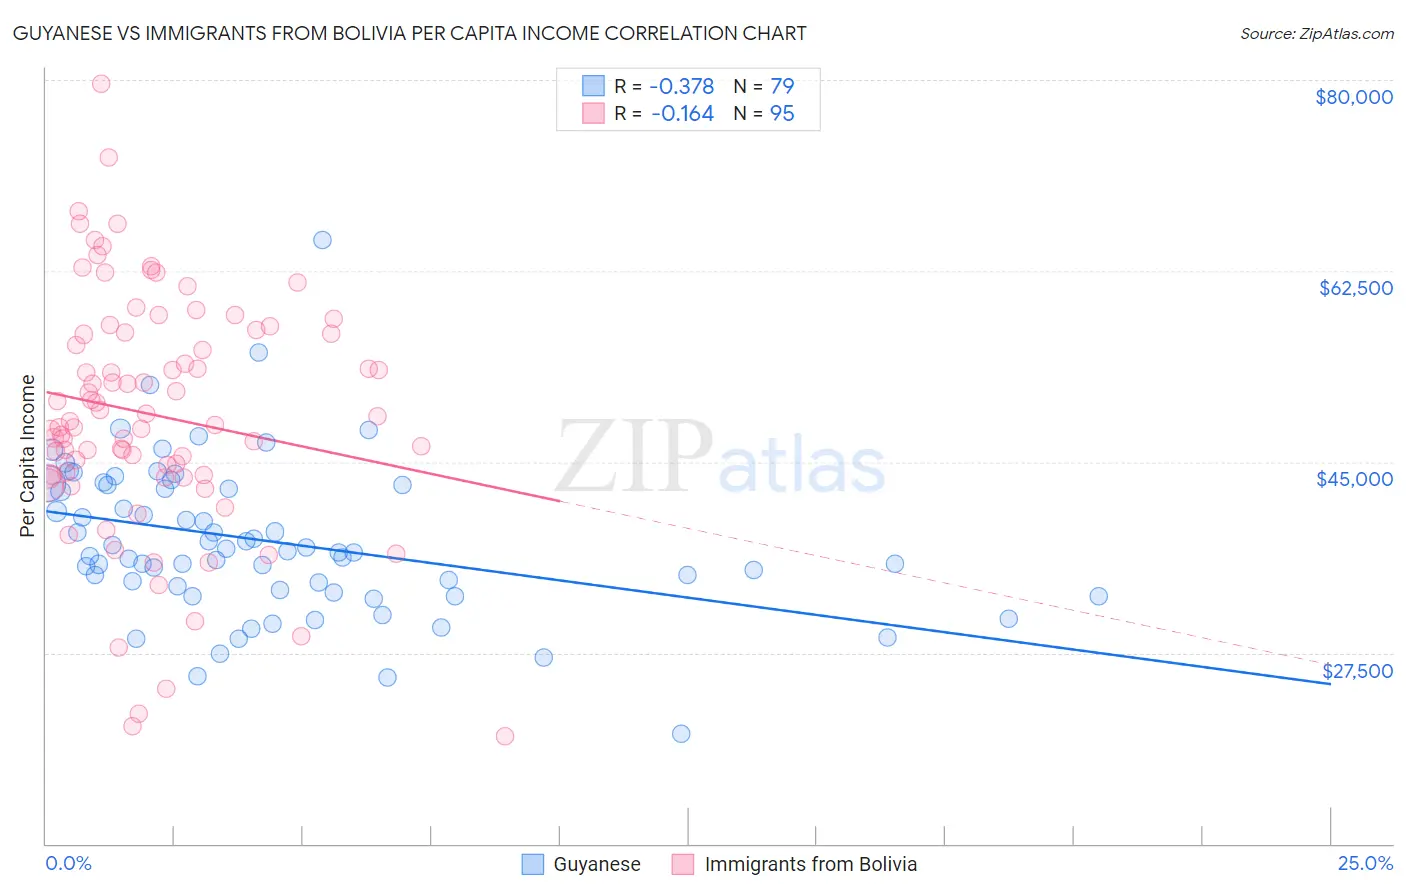
Guyanese vs Immigrants from Bolivia Per Capita Income Correlation Chart
The statistical analysis conducted on geographies consisting of 176,945,802 people shows a mild negative correlation between the proportion of Guyanese and per capita income in the United States with a correlation coefficient (R) of -0.378 and weighted average of $40,949. Similarly, the statistical analysis conducted on geographies consisting of 158,726,155 people shows a poor negative correlation between the proportion of Immigrants from Bolivia and per capita income in the United States with a correlation coefficient (R) of -0.164 and weighted average of $48,970, a difference of 19.6%.
Per Capita Income Correlation Summary
| Measurement | Guyanese | Immigrants from Bolivia |
| Minimum | $20,131 | $19,857 |
| Maximum | $65,314 | $79,655 |
| Range | $45,183 | $59,798 |
| Mean | $37,694 | $49,279 |
| Median | $36,719 | $48,688 |
| Interquartile 25% (IQ1) | $33,285 | $43,768 |
| Interquartile 75% (IQ3) | $42,829 | $56,811 |
| Interquartile Range (IQR) | $9,544 | $13,042 |
| Standard Deviation (Sample) | $7,132 | $11,114 |
| Standard Deviation (Population) | $7,087 | $11,056 |
Similar Demographics by Per Capita Income
Demographics Similar to Guyanese by Per Capita Income
In terms of per capita income, the demographic groups most similar to Guyanese are Senegalese ($41,000, a difference of 0.12%), Native Hawaiian ($41,017, a difference of 0.16%), Nigerian ($41,026, a difference of 0.19%), Immigrants from Grenada ($41,123, a difference of 0.42%), and Delaware ($40,778, a difference of 0.42%).
| Demographics | Rating | Rank | Per Capita Income |
| West Indians | 6.0 /100 | #225 | Tragic $41,217 |
| Immigrants | Ecuador | 5.9 /100 | #226 | Tragic $41,195 |
| Immigrants | Ghana | 5.5 /100 | #227 | Tragic $41,131 |
| Immigrants | Grenada | 5.5 /100 | #228 | Tragic $41,123 |
| Nigerians | 4.9 /100 | #229 | Tragic $41,026 |
| Native Hawaiians | 4.9 /100 | #230 | Tragic $41,017 |
| Senegalese | 4.8 /100 | #231 | Tragic $41,000 |
| Guyanese | 4.5 /100 | #232 | Tragic $40,949 |
| Delaware | 3.8 /100 | #233 | Tragic $40,778 |
| Immigrants | West Indies | 3.7 /100 | #234 | Tragic $40,763 |
| Immigrants | Guyana | 3.6 /100 | #235 | Tragic $40,742 |
| Immigrants | Nonimmigrants | 3.4 /100 | #236 | Tragic $40,669 |
| Immigrants | Cambodia | 2.6 /100 | #237 | Tragic $40,434 |
| Somalis | 2.4 /100 | #238 | Tragic $40,367 |
| Tsimshian | 2.4 /100 | #239 | Tragic $40,344 |
Demographics Similar to Immigrants from Bolivia by Per Capita Income
In terms of per capita income, the demographic groups most similar to Immigrants from Bolivia are Immigrants from England ($48,844, a difference of 0.26%), Mongolian ($49,173, a difference of 0.41%), Immigrants from Kazakhstan ($48,747, a difference of 0.46%), Immigrants from Italy ($48,654, a difference of 0.65%), and Immigrants from Hungary ($49,303, a difference of 0.68%).
| Demographics | Rating | Rank | Per Capita Income |
| Lithuanians | 99.8 /100 | #68 | Exceptional $49,448 |
| Immigrants | Canada | 99.8 /100 | #69 | Exceptional $49,412 |
| Immigrants | Eastern Europe | 99.8 /100 | #70 | Exceptional $49,316 |
| Greeks | 99.8 /100 | #71 | Exceptional $49,309 |
| Immigrants | Hungary | 99.8 /100 | #72 | Exceptional $49,303 |
| Immigrants | North America | 99.8 /100 | #73 | Exceptional $49,302 |
| Mongolians | 99.8 /100 | #74 | Exceptional $49,173 |
| Immigrants | Bolivia | 99.7 /100 | #75 | Exceptional $48,970 |
| Immigrants | England | 99.7 /100 | #76 | Exceptional $48,844 |
| Immigrants | Kazakhstan | 99.7 /100 | #77 | Exceptional $48,747 |
| Immigrants | Italy | 99.6 /100 | #78 | Exceptional $48,654 |
| Romanians | 99.5 /100 | #79 | Exceptional $48,445 |
| Egyptians | 99.5 /100 | #80 | Exceptional $48,358 |
| Armenians | 99.4 /100 | #81 | Exceptional $48,287 |
| Immigrants | Indonesia | 99.4 /100 | #82 | Exceptional $48,195 |