Guatemalan vs Immigrants from Australia Householder Income Ages 25 - 44 years
COMPARE
Guatemalan
Immigrants from Australia
Householder Income Ages 25 - 44 years
Householder Income Ages 25 - 44 years Comparison
Guatemalans
Immigrants from Australia
$82,331
HOUSEHOLDER INCOME AGES 25 - 44 YEARS
0.1/ 100
METRIC RATING
283rd/ 347
METRIC RANK
$115,947
HOUSEHOLDER INCOME AGES 25 - 44 YEARS
100.0/ 100
METRIC RATING
17th/ 347
METRIC RANK
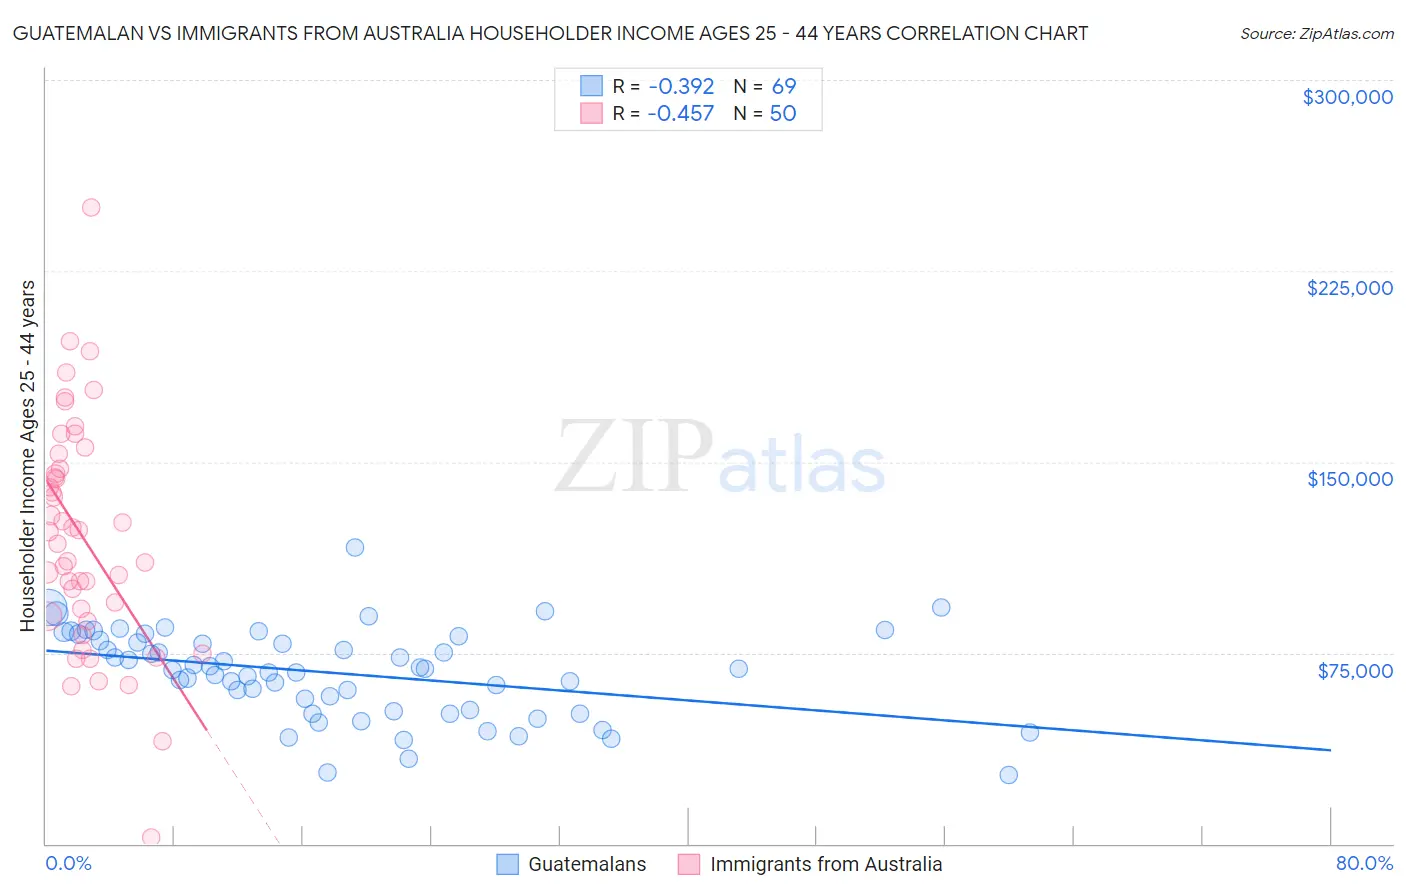
Guatemalan vs Immigrants from Australia Householder Income Ages 25 - 44 years Correlation Chart
The statistical analysis conducted on geographies consisting of 408,654,214 people shows a mild negative correlation between the proportion of Guatemalans and household income with householder between the ages 25 and 44 in the United States with a correlation coefficient (R) of -0.392 and weighted average of $82,331. Similarly, the statistical analysis conducted on geographies consisting of 226,902,734 people shows a moderate negative correlation between the proportion of Immigrants from Australia and household income with householder between the ages 25 and 44 in the United States with a correlation coefficient (R) of -0.457 and weighted average of $115,947, a difference of 40.8%.
Householder Income Ages 25 - 44 years Correlation Summary
| Measurement | Guatemalan | Immigrants from Australia |
| Minimum | $26,896 | $2,499 |
| Maximum | $116,391 | $250,001 |
| Range | $89,495 | $247,502 |
| Mean | $66,998 | $120,207 |
| Median | $68,529 | $120,330 |
| Interquartile 25% (IQ1) | $52,170 | $89,211 |
| Interquartile 75% (IQ3) | $80,667 | $147,110 |
| Interquartile Range (IQR) | $28,496 | $57,899 |
| Standard Deviation (Sample) | $17,389 | $45,319 |
| Standard Deviation (Population) | $17,262 | $44,864 |
Similar Demographics by Householder Income Ages 25 - 44 years
Demographics Similar to Guatemalans by Householder Income Ages 25 - 44 years
In terms of householder income ages 25 - 44 years, the demographic groups most similar to Guatemalans are Central American Indian ($82,355, a difference of 0.030%), Cajun ($82,393, a difference of 0.070%), Immigrants from Middle Africa ($82,254, a difference of 0.090%), Immigrants from Somalia ($82,188, a difference of 0.17%), and Ute ($82,166, a difference of 0.20%).
| Demographics | Rating | Rank | Householder Income Ages 25 - 44 years |
| Immigrants | Belize | 0.2 /100 | #276 | Tragic $83,141 |
| Paiute | 0.2 /100 | #277 | Tragic $82,984 |
| Senegalese | 0.2 /100 | #278 | Tragic $82,852 |
| Pima | 0.1 /100 | #279 | Tragic $82,821 |
| Colville | 0.1 /100 | #280 | Tragic $82,604 |
| Cajuns | 0.1 /100 | #281 | Tragic $82,393 |
| Central American Indians | 0.1 /100 | #282 | Tragic $82,355 |
| Guatemalans | 0.1 /100 | #283 | Tragic $82,331 |
| Immigrants | Middle Africa | 0.1 /100 | #284 | Tragic $82,254 |
| Immigrants | Somalia | 0.1 /100 | #285 | Tragic $82,188 |
| Ute | 0.1 /100 | #286 | Tragic $82,166 |
| Immigrants | Latin America | 0.1 /100 | #287 | Tragic $82,166 |
| Comanche | 0.1 /100 | #288 | Tragic $82,152 |
| Shoshone | 0.1 /100 | #289 | Tragic $82,062 |
| Liberians | 0.1 /100 | #290 | Tragic $82,005 |
Demographics Similar to Immigrants from Australia by Householder Income Ages 25 - 44 years
In terms of householder income ages 25 - 44 years, the demographic groups most similar to Immigrants from Australia are Cypriot ($116,364, a difference of 0.36%), Immigrants from South Central Asia ($116,626, a difference of 0.59%), Immigrants from Israel ($117,219, a difference of 1.1%), Eastern European ($114,523, a difference of 1.2%), and Immigrants from Eastern Asia ($118,056, a difference of 1.8%).
| Demographics | Rating | Rank | Householder Income Ages 25 - 44 years |
| Indians (Asian) | 100.0 /100 | #10 | Exceptional $119,496 |
| Okinawans | 100.0 /100 | #11 | Exceptional $119,349 |
| Immigrants | Iran | 100.0 /100 | #12 | Exceptional $119,204 |
| Immigrants | Eastern Asia | 100.0 /100 | #13 | Exceptional $118,056 |
| Immigrants | Israel | 100.0 /100 | #14 | Exceptional $117,219 |
| Immigrants | South Central Asia | 100.0 /100 | #15 | Exceptional $116,626 |
| Cypriots | 100.0 /100 | #16 | Exceptional $116,364 |
| Immigrants | Australia | 100.0 /100 | #17 | Exceptional $115,947 |
| Eastern Europeans | 100.0 /100 | #18 | Exceptional $114,523 |
| Burmese | 100.0 /100 | #19 | Exceptional $113,701 |
| Immigrants | Korea | 100.0 /100 | #20 | Exceptional $113,401 |
| Asians | 100.0 /100 | #21 | Exceptional $112,666 |
| Immigrants | Belgium | 100.0 /100 | #22 | Exceptional $112,575 |
| Immigrants | Japan | 100.0 /100 | #23 | Exceptional $112,228 |
| Immigrants | Sweden | 100.0 /100 | #24 | Exceptional $112,010 |