Guamanian/Chamorro vs Osage Householder Income Under 25 years
COMPARE
Guamanian/Chamorro
Osage
Householder Income Under 25 years
Householder Income Under 25 years Comparison
Guamanians/Chamorros
Osage
$53,423
HOUSEHOLDER INCOME UNDER 25 YEARS
95.3/ 100
METRIC RATING
120th/ 347
METRIC RANK
$45,764
HOUSEHOLDER INCOME UNDER 25 YEARS
0.0/ 100
METRIC RATING
326th/ 347
METRIC RANK
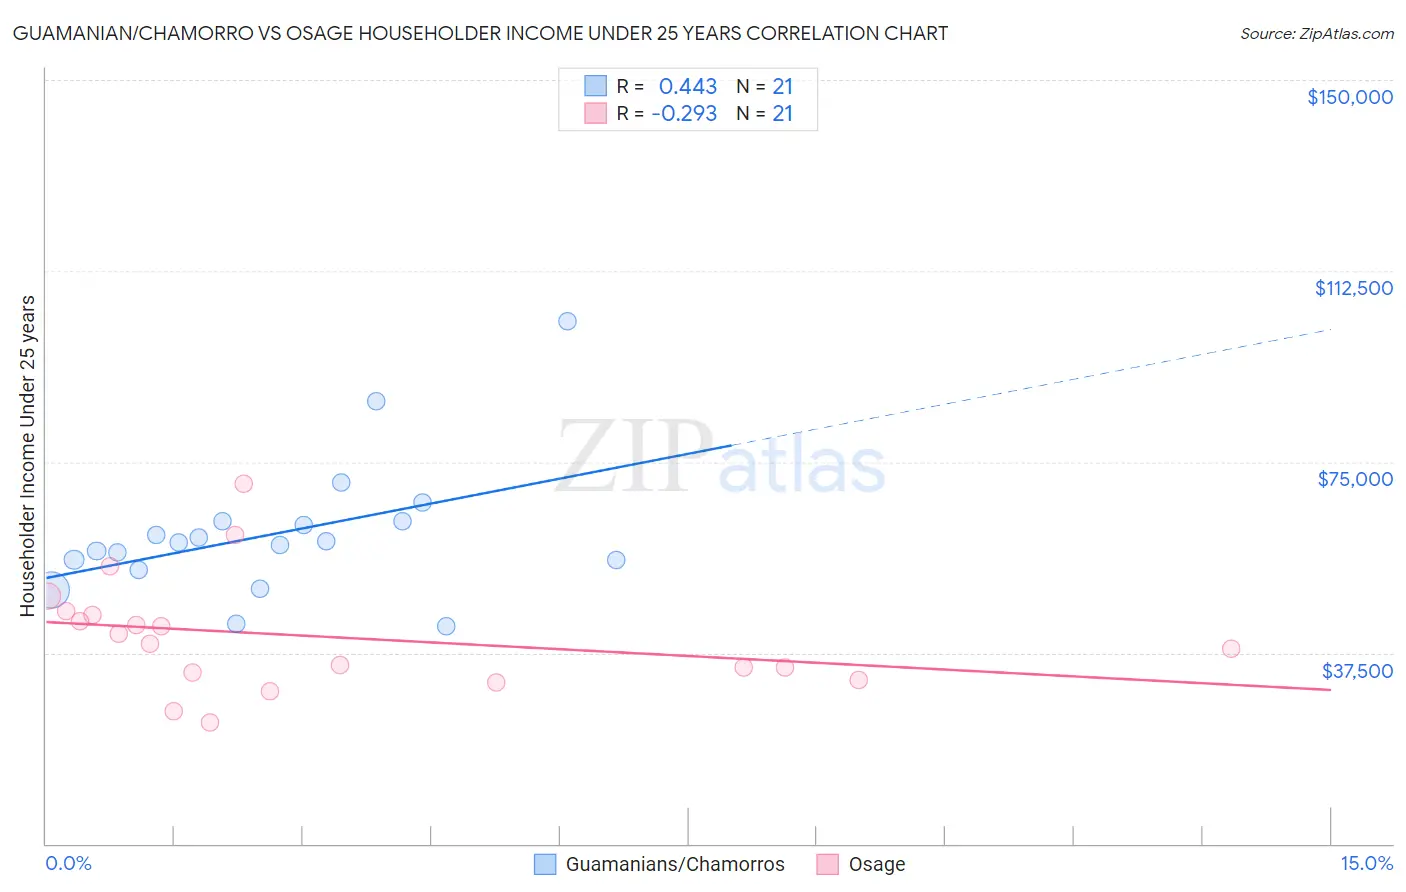
Guamanian/Chamorro vs Osage Householder Income Under 25 years Correlation Chart
The statistical analysis conducted on geographies consisting of 200,760,858 people shows a moderate positive correlation between the proportion of Guamanians/Chamorros and household income with householder under the age of 25 in the United States with a correlation coefficient (R) of 0.443 and weighted average of $53,423. Similarly, the statistical analysis conducted on geographies consisting of 87,289,691 people shows a weak negative correlation between the proportion of Osage and household income with householder under the age of 25 in the United States with a correlation coefficient (R) of -0.293 and weighted average of $45,764, a difference of 16.7%.
Householder Income Under 25 years Correlation Summary
| Measurement | Guamanian/Chamorro | Osage |
| Minimum | $42,829 | $23,750 |
| Maximum | $102,571 | $70,795 |
| Range | $59,742 | $47,045 |
| Mean | $60,959 | $40,691 |
| Median | $59,082 | $39,256 |
| Interquartile 25% (IQ1) | $54,739 | $32,844 |
| Interquartile 75% (IQ3) | $63,324 | $45,298 |
| Interquartile Range (IQR) | $8,585 | $12,454 |
| Standard Deviation (Sample) | $13,387 | $11,304 |
| Standard Deviation (Population) | $13,064 | $11,031 |
Similar Demographics by Householder Income Under 25 years
Demographics Similar to Guamanians/Chamorros by Householder Income Under 25 years
In terms of householder income under 25 years, the demographic groups most similar to Guamanians/Chamorros are Italian ($53,426, a difference of 0.010%), Immigrants from Canada ($53,411, a difference of 0.020%), Immigrants from Ethiopia ($53,408, a difference of 0.030%), Immigrants from Iraq ($53,384, a difference of 0.070%), and Colombian ($53,357, a difference of 0.12%).
| Demographics | Rating | Rank | Householder Income Under 25 years |
| Romanians | 97.2 /100 | #113 | Exceptional $53,632 |
| Immigrants | Sweden | 97.1 /100 | #114 | Exceptional $53,621 |
| Immigrants | Albania | 96.9 /100 | #115 | Exceptional $53,597 |
| Immigrants | Spain | 96.6 /100 | #116 | Exceptional $53,560 |
| Lithuanians | 96.6 /100 | #117 | Exceptional $53,552 |
| Immigrants | Switzerland | 96.3 /100 | #118 | Exceptional $53,528 |
| Italians | 95.4 /100 | #119 | Exceptional $53,426 |
| Guamanians/Chamorros | 95.3 /100 | #120 | Exceptional $53,423 |
| Immigrants | Canada | 95.2 /100 | #121 | Exceptional $53,411 |
| Immigrants | Ethiopia | 95.2 /100 | #122 | Exceptional $53,408 |
| Immigrants | Iraq | 94.9 /100 | #123 | Exceptional $53,384 |
| Colombians | 94.6 /100 | #124 | Exceptional $53,357 |
| Pakistanis | 94.1 /100 | #125 | Exceptional $53,325 |
| Immigrants | Serbia | 94.1 /100 | #126 | Exceptional $53,321 |
| Immigrants | North America | 93.9 /100 | #127 | Exceptional $53,307 |
Demographics Similar to Osage by Householder Income Under 25 years
In terms of householder income under 25 years, the demographic groups most similar to Osage are Bahamian ($45,743, a difference of 0.050%), Immigrants from Bahamas ($45,793, a difference of 0.060%), Dutch West Indian ($45,816, a difference of 0.11%), German Russian ($45,673, a difference of 0.20%), and Seminole ($45,649, a difference of 0.25%).
| Demographics | Rating | Rank | Householder Income Under 25 years |
| Africans | 0.0 /100 | #319 | Tragic $46,838 |
| Immigrants | Sudan | 0.0 /100 | #320 | Tragic $46,791 |
| Potawatomi | 0.0 /100 | #321 | Tragic $46,462 |
| Sioux | 0.0 /100 | #322 | Tragic $46,417 |
| Immigrants | Saudi Arabia | 0.0 /100 | #323 | Tragic $46,187 |
| Dutch West Indians | 0.0 /100 | #324 | Tragic $45,816 |
| Immigrants | Bahamas | 0.0 /100 | #325 | Tragic $45,793 |
| Osage | 0.0 /100 | #326 | Tragic $45,764 |
| Bahamians | 0.0 /100 | #327 | Tragic $45,743 |
| German Russians | 0.0 /100 | #328 | Tragic $45,673 |
| Seminole | 0.0 /100 | #329 | Tragic $45,649 |
| Indonesians | 0.0 /100 | #330 | Tragic $45,566 |
| Immigrants | Zaire | 0.0 /100 | #331 | Tragic $45,529 |
| Choctaw | 0.0 /100 | #332 | Tragic $45,450 |
| Creek | 0.0 /100 | #333 | Tragic $45,371 |