Guamanian/Chamorro vs Nigerian Median Household Income
COMPARE
Guamanian/Chamorro
Nigerian
Median Household Income
Median Household Income Comparison
Guamanians/Chamorros
Nigerians
$86,255
MEDIAN HOUSEHOLD INCOME
67.7/ 100
METRIC RATING
162nd/ 347
METRIC RANK
$81,725
MEDIAN HOUSEHOLD INCOME
10.3/ 100
METRIC RATING
219th/ 347
METRIC RANK
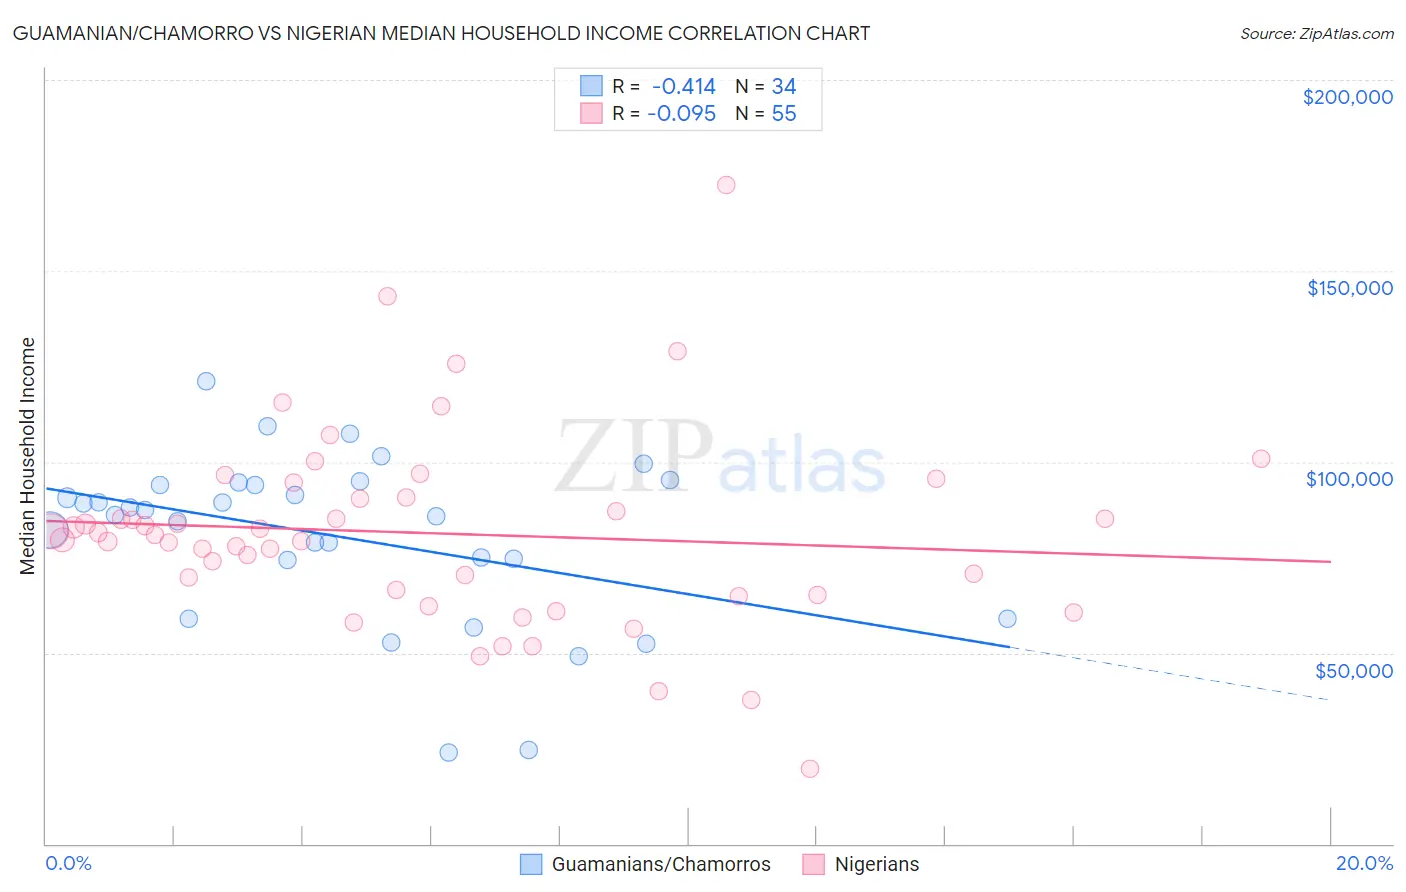
Guamanian/Chamorro vs Nigerian Median Household Income Correlation Chart
The statistical analysis conducted on geographies consisting of 221,863,113 people shows a moderate negative correlation between the proportion of Guamanians/Chamorros and median household income in the United States with a correlation coefficient (R) of -0.414 and weighted average of $86,255. Similarly, the statistical analysis conducted on geographies consisting of 332,385,010 people shows a slight negative correlation between the proportion of Nigerians and median household income in the United States with a correlation coefficient (R) of -0.095 and weighted average of $81,725, a difference of 5.5%.
Median Household Income Correlation Summary
| Measurement | Guamanian/Chamorro | Nigerian |
| Minimum | $23,750 | $19,722 |
| Maximum | $121,240 | $172,388 |
| Range | $97,490 | $152,666 |
| Mean | $80,405 | $81,339 |
| Median | $86,640 | $80,919 |
| Interquartile 25% (IQ1) | $74,171 | $65,240 |
| Interquartile 75% (IQ3) | $94,093 | $90,601 |
| Interquartile Range (IQR) | $19,922 | $25,361 |
| Standard Deviation (Sample) | $22,128 | $25,635 |
| Standard Deviation (Population) | $21,800 | $25,401 |
Similar Demographics by Median Household Income
Demographics Similar to Guamanians/Chamorros by Median Household Income
In terms of median household income, the demographic groups most similar to Guamanians/Chamorros are Czech ($86,164, a difference of 0.11%), Irish ($86,145, a difference of 0.13%), Slavic ($86,398, a difference of 0.17%), Luxembourger ($86,418, a difference of 0.19%), and Immigrants from Uzbekistan ($86,425, a difference of 0.20%).
| Demographics | Rating | Rank | Median Household Income |
| Carpatho Rusyns | 72.8 /100 | #155 | Good $86,635 |
| Immigrants | Albania | 71.5 /100 | #156 | Good $86,534 |
| Samoans | 71.0 /100 | #157 | Good $86,498 |
| Moroccans | 70.6 /100 | #158 | Good $86,468 |
| Immigrants | Uzbekistan | 70.1 /100 | #159 | Good $86,425 |
| Luxembourgers | 70.0 /100 | #160 | Good $86,418 |
| Slavs | 69.7 /100 | #161 | Good $86,398 |
| Guamanians/Chamorros | 67.7 /100 | #162 | Good $86,255 |
| Czechs | 66.4 /100 | #163 | Good $86,164 |
| Irish | 66.2 /100 | #164 | Good $86,145 |
| Norwegians | 65.3 /100 | #165 | Good $86,084 |
| Scandinavians | 65.1 /100 | #166 | Good $86,073 |
| Immigrants | Immigrants | 61.3 /100 | #167 | Good $85,818 |
| Icelanders | 61.0 /100 | #168 | Good $85,797 |
| Colombians | 59.7 /100 | #169 | Average $85,716 |
Demographics Similar to Nigerians by Median Household Income
In terms of median household income, the demographic groups most similar to Nigerians are Immigrants from Venezuela ($81,506, a difference of 0.27%), Immigrants from Ghana ($81,489, a difference of 0.29%), White/Caucasian ($82,029, a difference of 0.37%), Ecuadorian ($82,070, a difference of 0.42%), and Yugoslavian ($82,186, a difference of 0.56%).
| Demographics | Rating | Rank | Median Household Income |
| Venezuelans | 15.3 /100 | #212 | Poor $82,432 |
| Nepalese | 15.1 /100 | #213 | Poor $82,410 |
| Panamanians | 14.0 /100 | #214 | Poor $82,272 |
| Vietnamese | 13.8 /100 | #215 | Poor $82,248 |
| Yugoslavians | 13.3 /100 | #216 | Poor $82,186 |
| Ecuadorians | 12.5 /100 | #217 | Poor $82,070 |
| Whites/Caucasians | 12.2 /100 | #218 | Poor $82,029 |
| Nigerians | 10.3 /100 | #219 | Poor $81,725 |
| Immigrants | Venezuela | 9.0 /100 | #220 | Tragic $81,506 |
| Immigrants | Ghana | 9.0 /100 | #221 | Tragic $81,489 |
| Immigrants | Nigeria | 7.7 /100 | #222 | Tragic $81,236 |
| Immigrants | El Salvador | 7.6 /100 | #223 | Tragic $81,213 |
| Malaysians | 7.0 /100 | #224 | Tragic $81,064 |
| Scotch-Irish | 6.6 /100 | #225 | Tragic $80,972 |
| Immigrants | Panama | 6.2 /100 | #226 | Tragic $80,873 |