Guamanian/Chamorro vs Bolivian Median Earnings
COMPARE
Guamanian/Chamorro
Bolivian
Median Earnings
Median Earnings Comparison
Guamanians/Chamorros
Bolivians
$45,933
MEDIAN EARNINGS
33.2/ 100
METRIC RATING
193rd/ 347
METRIC RANK
$52,005
MEDIAN EARNINGS
100.0/ 100
METRIC RATING
49th/ 347
METRIC RANK
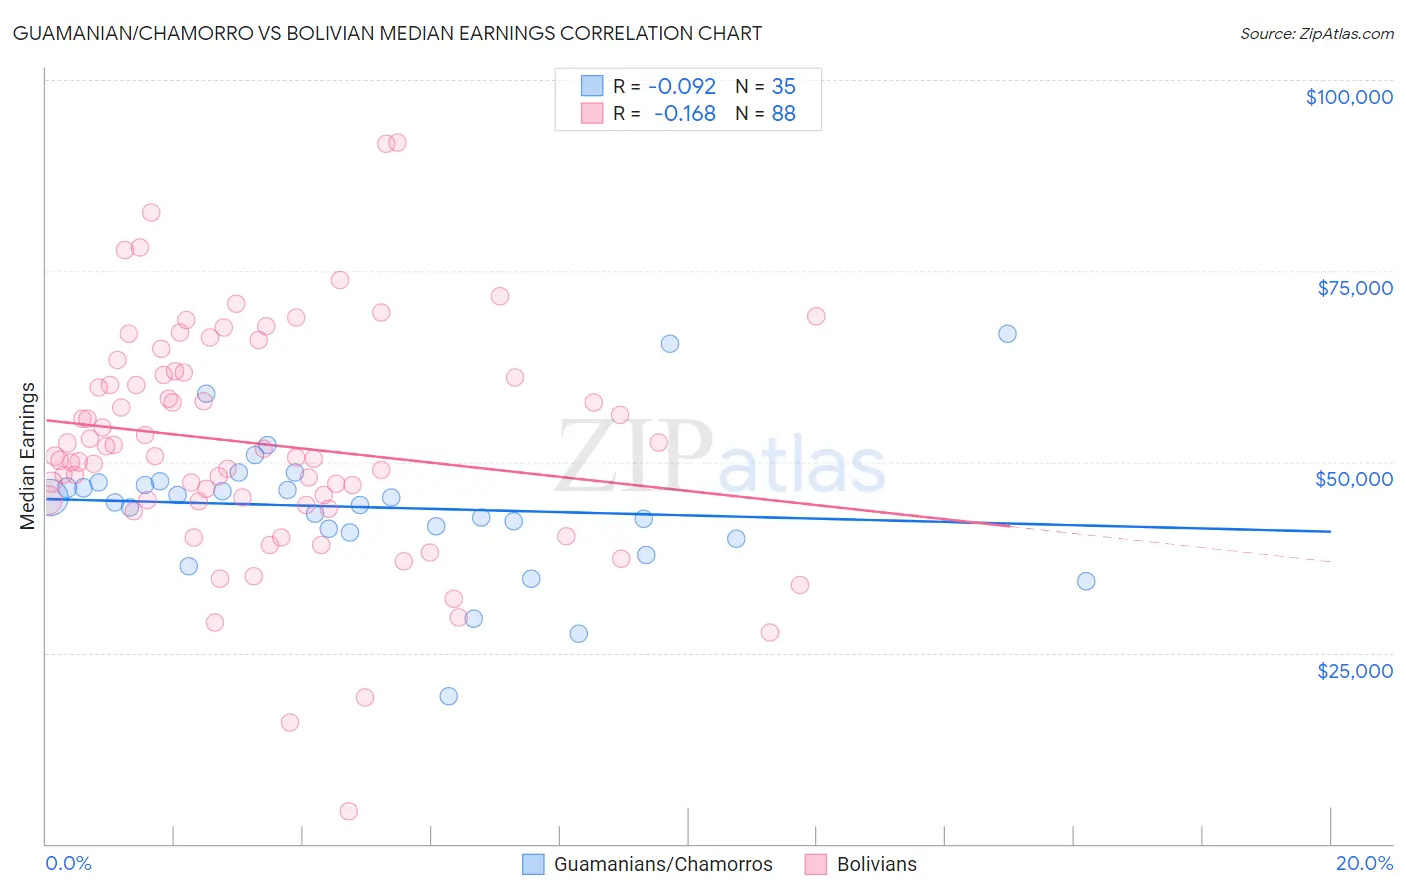
Guamanian/Chamorro vs Bolivian Median Earnings Correlation Chart
The statistical analysis conducted on geographies consisting of 221,957,733 people shows a slight negative correlation between the proportion of Guamanians/Chamorros and median earnings in the United States with a correlation coefficient (R) of -0.092 and weighted average of $45,933. Similarly, the statistical analysis conducted on geographies consisting of 184,675,536 people shows a poor negative correlation between the proportion of Bolivians and median earnings in the United States with a correlation coefficient (R) of -0.168 and weighted average of $52,005, a difference of 13.2%.
Median Earnings Correlation Summary
| Measurement | Guamanian/Chamorro | Bolivian |
| Minimum | $19,375 | $4,250 |
| Maximum | $66,750 | $91,786 |
| Range | $47,375 | $87,536 |
| Mean | $44,054 | $52,342 |
| Median | $44,687 | $50,729 |
| Interquartile 25% (IQ1) | $40,774 | $44,853 |
| Interquartile 75% (IQ3) | $47,334 | $61,590 |
| Interquartile Range (IQR) | $6,560 | $16,737 |
| Standard Deviation (Sample) | $9,126 | $15,104 |
| Standard Deviation (Population) | $8,995 | $15,018 |
Similar Demographics by Median Earnings
Demographics Similar to Guamanians/Chamorros by Median Earnings
In terms of median earnings, the demographic groups most similar to Guamanians/Chamorros are German ($45,935, a difference of 0.0%), Finnish ($45,940, a difference of 0.010%), Immigrants from Costa Rica ($45,928, a difference of 0.010%), Immigrants from St. Vincent and the Grenadines ($45,908, a difference of 0.060%), and Yugoslavian ($45,846, a difference of 0.19%).
| Demographics | Rating | Rank | Median Earnings |
| Vietnamese | 40.9 /100 | #186 | Average $46,172 |
| Iraqis | 39.9 /100 | #187 | Fair $46,140 |
| Immigrants | Armenia | 38.3 /100 | #188 | Fair $46,094 |
| Spaniards | 37.2 /100 | #189 | Fair $46,059 |
| French Canadians | 36.1 /100 | #190 | Fair $46,026 |
| Finns | 33.4 /100 | #191 | Fair $45,940 |
| Germans | 33.2 /100 | #192 | Fair $45,935 |
| Guamanians/Chamorros | 33.2 /100 | #193 | Fair $45,933 |
| Immigrants | Costa Rica | 33.0 /100 | #194 | Fair $45,928 |
| Immigrants | St. Vincent and the Grenadines | 32.4 /100 | #195 | Fair $45,908 |
| Yugoslavians | 30.5 /100 | #196 | Fair $45,846 |
| Barbadians | 30.5 /100 | #197 | Fair $45,846 |
| Trinidadians and Tobagonians | 29.7 /100 | #198 | Fair $45,820 |
| Immigrants | Barbados | 29.6 /100 | #199 | Fair $45,816 |
| Immigrants | Azores | 29.5 /100 | #200 | Fair $45,812 |
Demographics Similar to Bolivians by Median Earnings
In terms of median earnings, the demographic groups most similar to Bolivians are Immigrants from South Africa ($51,850, a difference of 0.30%), Immigrants from Austria ($51,826, a difference of 0.35%), Immigrants from Europe ($52,195, a difference of 0.37%), Estonian ($51,772, a difference of 0.45%), and Immigrants from Norway ($51,758, a difference of 0.48%).
| Demographics | Rating | Rank | Median Earnings |
| Maltese | 100.0 /100 | #42 | Exceptional $52,526 |
| Immigrants | Malaysia | 100.0 /100 | #43 | Exceptional $52,514 |
| Bulgarians | 100.0 /100 | #44 | Exceptional $52,512 |
| Immigrants | Czechoslovakia | 100.0 /100 | #45 | Exceptional $52,361 |
| Bhutanese | 100.0 /100 | #46 | Exceptional $52,297 |
| Australians | 100.0 /100 | #47 | Exceptional $52,294 |
| Immigrants | Europe | 100.0 /100 | #48 | Exceptional $52,195 |
| Bolivians | 100.0 /100 | #49 | Exceptional $52,005 |
| Immigrants | South Africa | 100.0 /100 | #50 | Exceptional $51,850 |
| Immigrants | Austria | 99.9 /100 | #51 | Exceptional $51,826 |
| Estonians | 99.9 /100 | #52 | Exceptional $51,772 |
| Immigrants | Norway | 99.9 /100 | #53 | Exceptional $51,758 |
| Immigrants | Indonesia | 99.9 /100 | #54 | Exceptional $51,715 |
| Egyptians | 99.9 /100 | #55 | Exceptional $51,701 |
| Immigrants | Pakistan | 99.9 /100 | #56 | Exceptional $51,693 |