Ghanaian vs Alaskan Athabascan Householder Income Over 65 years
COMPARE
Ghanaian
Alaskan Athabascan
Householder Income Over 65 years
Householder Income Over 65 years Comparison
Ghanaians
Alaskan Athabascans
$60,043
HOUSEHOLDER INCOME OVER 65 YEARS
27.5/ 100
METRIC RATING
189th/ 347
METRIC RANK
$62,330
HOUSEHOLDER INCOME OVER 65 YEARS
80.6/ 100
METRIC RATING
136th/ 347
METRIC RANK
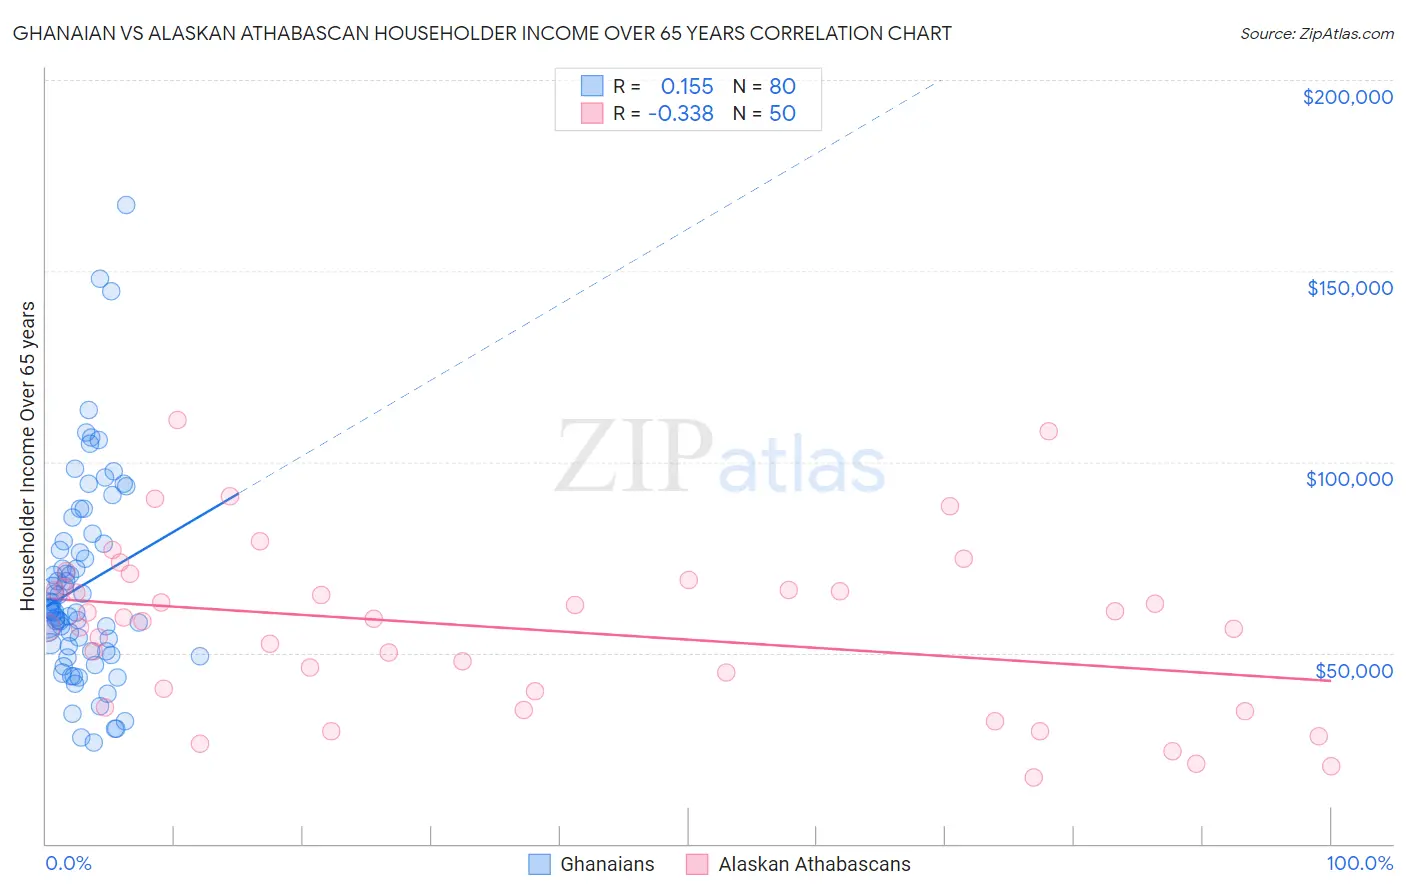
Ghanaian vs Alaskan Athabascan Householder Income Over 65 years Correlation Chart
The statistical analysis conducted on geographies consisting of 190,075,998 people shows a poor positive correlation between the proportion of Ghanaians and household income with householder over the age of 65 in the United States with a correlation coefficient (R) of 0.155 and weighted average of $60,043. Similarly, the statistical analysis conducted on geographies consisting of 45,769,893 people shows a mild negative correlation between the proportion of Alaskan Athabascans and household income with householder over the age of 65 in the United States with a correlation coefficient (R) of -0.338 and weighted average of $62,330, a difference of 3.8%.
Householder Income Over 65 years Correlation Summary
| Measurement | Ghanaian | Alaskan Athabascan |
| Minimum | $26,429 | $17,188 |
| Maximum | $167,368 | $111,125 |
| Range | $140,939 | $93,937 |
| Mean | $67,634 | $56,372 |
| Median | $61,218 | $58,696 |
| Interquartile 25% (IQ1) | $50,453 | $40,000 |
| Interquartile 75% (IQ3) | $78,943 | $67,202 |
| Interquartile Range (IQR) | $28,490 | $27,202 |
| Standard Deviation (Sample) | $26,645 | $21,725 |
| Standard Deviation (Population) | $26,478 | $21,506 |
Similar Demographics by Householder Income Over 65 years
Demographics Similar to Ghanaians by Householder Income Over 65 years
In terms of householder income over 65 years, the demographic groups most similar to Ghanaians are Immigrants from Eritrea ($60,096, a difference of 0.090%), Puget Sound Salish ($59,934, a difference of 0.18%), Belgian ($59,915, a difference of 0.21%), Immigrants from Thailand ($60,217, a difference of 0.29%), and South American ($59,854, a difference of 0.32%).
| Demographics | Rating | Rank | Householder Income Over 65 years |
| Czechoslovakians | 40.0 /100 | #182 | Average $60,581 |
| Kenyans | 38.4 /100 | #183 | Fair $60,514 |
| Iraqis | 37.2 /100 | #184 | Fair $60,466 |
| Albanians | 32.0 /100 | #185 | Fair $60,249 |
| Slovenes | 31.8 /100 | #186 | Fair $60,241 |
| Immigrants | Thailand | 31.3 /100 | #187 | Fair $60,217 |
| Immigrants | Eritrea | 28.6 /100 | #188 | Fair $60,096 |
| Ghanaians | 27.5 /100 | #189 | Fair $60,043 |
| Puget Sound Salish | 25.3 /100 | #190 | Fair $59,934 |
| Belgians | 24.9 /100 | #191 | Fair $59,915 |
| South Americans | 23.8 /100 | #192 | Fair $59,854 |
| Immigrants | Costa Rica | 23.6 /100 | #193 | Fair $59,848 |
| Immigrants | Africa | 23.4 /100 | #194 | Fair $59,837 |
| Immigrants | Iraq | 23.2 /100 | #195 | Fair $59,824 |
| Germans | 21.5 /100 | #196 | Fair $59,730 |
Demographics Similar to Alaskan Athabascans by Householder Income Over 65 years
In terms of householder income over 65 years, the demographic groups most similar to Alaskan Athabascans are Immigrants from Chile ($62,354, a difference of 0.040%), Immigrants from Syria ($62,303, a difference of 0.040%), Immigrants from Brazil ($62,364, a difference of 0.060%), Immigrants from Kazakhstan ($62,292, a difference of 0.060%), and Lebanese ($62,287, a difference of 0.070%).
| Demographics | Rating | Rank | Householder Income Over 65 years |
| Immigrants | Eastern Europe | 85.9 /100 | #129 | Excellent $62,693 |
| Basques | 85.4 /100 | #130 | Excellent $62,653 |
| Immigrants | Western Asia | 85.3 /100 | #131 | Excellent $62,645 |
| Immigrants | Germany | 83.9 /100 | #132 | Excellent $62,544 |
| Immigrants | Northern Africa | 83.6 /100 | #133 | Excellent $62,522 |
| Immigrants | Brazil | 81.2 /100 | #134 | Excellent $62,364 |
| Immigrants | Chile | 81.0 /100 | #135 | Excellent $62,354 |
| Alaskan Athabascans | 80.6 /100 | #136 | Excellent $62,330 |
| Immigrants | Syria | 80.2 /100 | #137 | Excellent $62,303 |
| Immigrants | Kazakhstan | 80.0 /100 | #138 | Excellent $62,292 |
| Lebanese | 79.9 /100 | #139 | Good $62,287 |
| Arabs | 79.6 /100 | #140 | Good $62,266 |
| Canadians | 79.0 /100 | #141 | Good $62,230 |
| South American Indians | 78.7 /100 | #142 | Good $62,215 |
| Immigrants | Belarus | 77.8 /100 | #143 | Good $62,162 |