German Russian vs Mexican American Indian Householder Income Under 25 years
COMPARE
German Russian
Mexican American Indian
Householder Income Under 25 years
Householder Income Under 25 years Comparison
German Russians
Mexican American Indians
$45,673
HOUSEHOLDER INCOME UNDER 25 YEARS
0.0/ 100
METRIC RATING
328th/ 347
METRIC RANK
$51,783
HOUSEHOLDER INCOME UNDER 25 YEARS
27.0/ 100
METRIC RATING
183rd/ 347
METRIC RANK
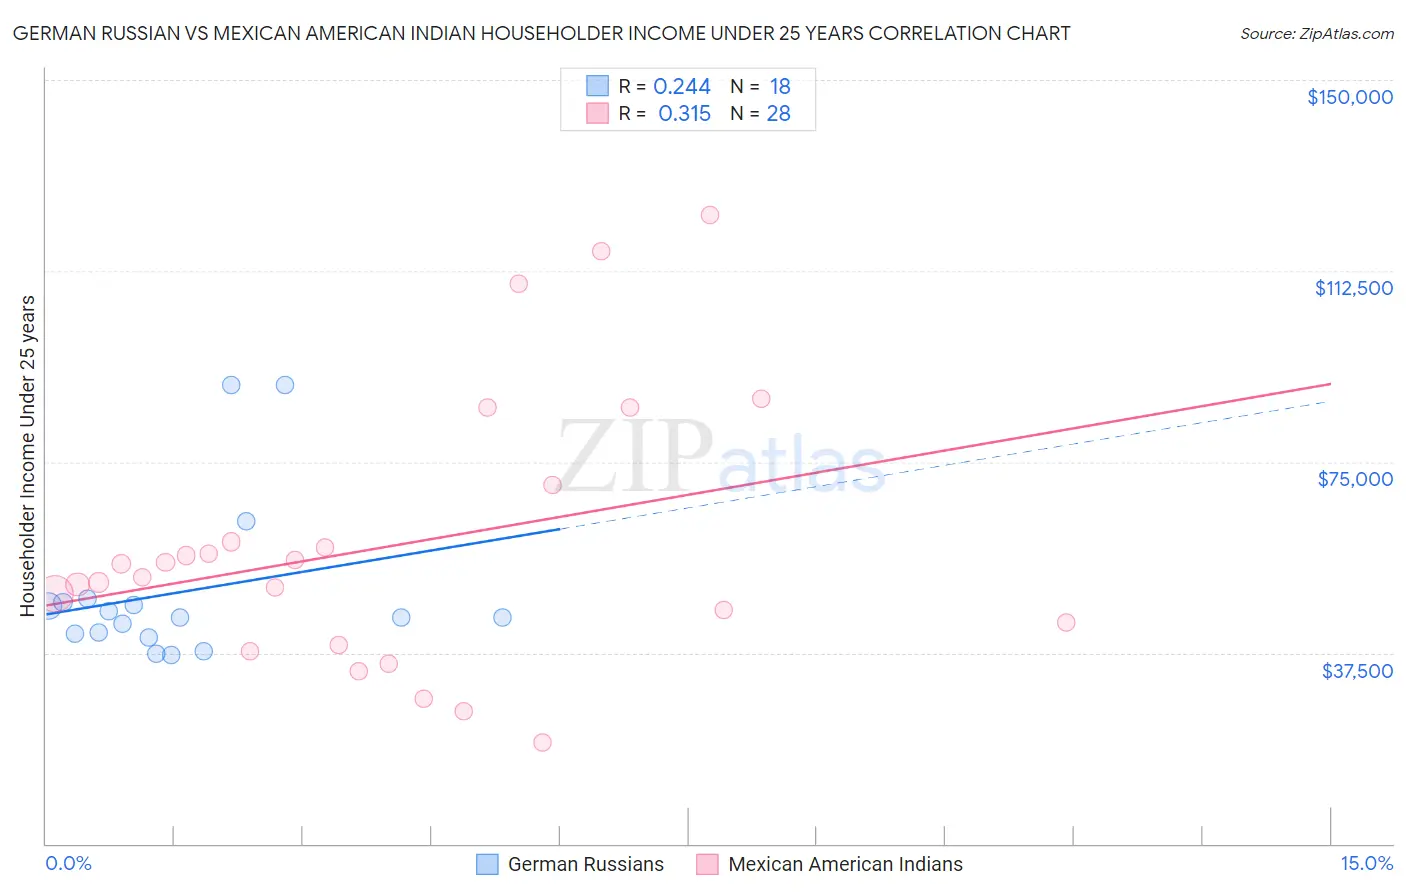
German Russian vs Mexican American Indian Householder Income Under 25 years Correlation Chart
The statistical analysis conducted on geographies consisting of 91,630,953 people shows a weak positive correlation between the proportion of German Russians and household income with householder under the age of 25 in the United States with a correlation coefficient (R) of 0.244 and weighted average of $45,673. Similarly, the statistical analysis conducted on geographies consisting of 281,148,654 people shows a mild positive correlation between the proportion of Mexican American Indians and household income with householder under the age of 25 in the United States with a correlation coefficient (R) of 0.315 and weighted average of $51,783, a difference of 13.4%.
Householder Income Under 25 years Correlation Summary
| Measurement | German Russian | Mexican American Indian |
| Minimum | $37,121 | $20,000 |
| Maximum | $90,000 | $123,444 |
| Range | $52,879 | $103,444 |
| Mean | $49,457 | $58,543 |
| Median | $44,409 | $53,633 |
| Interquartile 25% (IQ1) | $41,330 | $41,184 |
| Interquartile 75% (IQ3) | $47,417 | $64,825 |
| Interquartile Range (IQR) | $6,088 | $23,640 |
| Standard Deviation (Sample) | $15,850 | $26,373 |
| Standard Deviation (Population) | $15,403 | $25,898 |
Similar Demographics by Householder Income Under 25 years
Demographics Similar to German Russians by Householder Income Under 25 years
In terms of householder income under 25 years, the demographic groups most similar to German Russians are Seminole ($45,649, a difference of 0.050%), Bahamian ($45,743, a difference of 0.15%), Osage ($45,764, a difference of 0.20%), Indonesian ($45,566, a difference of 0.23%), and Immigrants from Bahamas ($45,793, a difference of 0.26%).
| Demographics | Rating | Rank | Householder Income Under 25 years |
| Potawatomi | 0.0 /100 | #321 | Tragic $46,462 |
| Sioux | 0.0 /100 | #322 | Tragic $46,417 |
| Immigrants | Saudi Arabia | 0.0 /100 | #323 | Tragic $46,187 |
| Dutch West Indians | 0.0 /100 | #324 | Tragic $45,816 |
| Immigrants | Bahamas | 0.0 /100 | #325 | Tragic $45,793 |
| Osage | 0.0 /100 | #326 | Tragic $45,764 |
| Bahamians | 0.0 /100 | #327 | Tragic $45,743 |
| German Russians | 0.0 /100 | #328 | Tragic $45,673 |
| Seminole | 0.0 /100 | #329 | Tragic $45,649 |
| Indonesians | 0.0 /100 | #330 | Tragic $45,566 |
| Immigrants | Zaire | 0.0 /100 | #331 | Tragic $45,529 |
| Choctaw | 0.0 /100 | #332 | Tragic $45,450 |
| Creek | 0.0 /100 | #333 | Tragic $45,371 |
| Cajuns | 0.0 /100 | #334 | Tragic $45,338 |
| Cheyenne | 0.0 /100 | #335 | Tragic $45,275 |
Demographics Similar to Mexican American Indians by Householder Income Under 25 years
In terms of householder income under 25 years, the demographic groups most similar to Mexican American Indians are European ($51,796, a difference of 0.030%), Jordanian ($51,796, a difference of 0.030%), Basque ($51,818, a difference of 0.070%), Immigrants from England ($51,817, a difference of 0.070%), and Paiute ($51,743, a difference of 0.080%).
| Demographics | Rating | Rank | Householder Income Under 25 years |
| Austrians | 32.9 /100 | #176 | Fair $51,898 |
| British West Indians | 30.0 /100 | #177 | Fair $51,844 |
| Finns | 29.2 /100 | #178 | Fair $51,827 |
| Basques | 28.7 /100 | #179 | Fair $51,818 |
| Immigrants | England | 28.7 /100 | #180 | Fair $51,817 |
| Europeans | 27.6 /100 | #181 | Fair $51,796 |
| Jordanians | 27.6 /100 | #182 | Fair $51,796 |
| Mexican American Indians | 27.0 /100 | #183 | Fair $51,783 |
| Paiute | 25.1 /100 | #184 | Fair $51,743 |
| Immigrants | Latvia | 24.8 /100 | #185 | Fair $51,737 |
| Alaskan Athabascans | 23.8 /100 | #186 | Fair $51,713 |
| Immigrants | South Africa | 23.4 /100 | #187 | Fair $51,705 |
| Northern Europeans | 22.2 /100 | #188 | Fair $51,678 |
| Croatians | 21.6 /100 | #189 | Fair $51,662 |
| Malaysians | 19.7 /100 | #190 | Poor $51,615 |