German Russian vs Iraqi Median Family Income
COMPARE
German Russian
Iraqi
Median Family Income
Median Family Income Comparison
German Russians
Iraqis
$93,858
MEDIAN FAMILY INCOME
1.1/ 100
METRIC RATING
243rd/ 347
METRIC RANK
$100,658
MEDIAN FAMILY INCOME
26.3/ 100
METRIC RATING
193rd/ 347
METRIC RANK
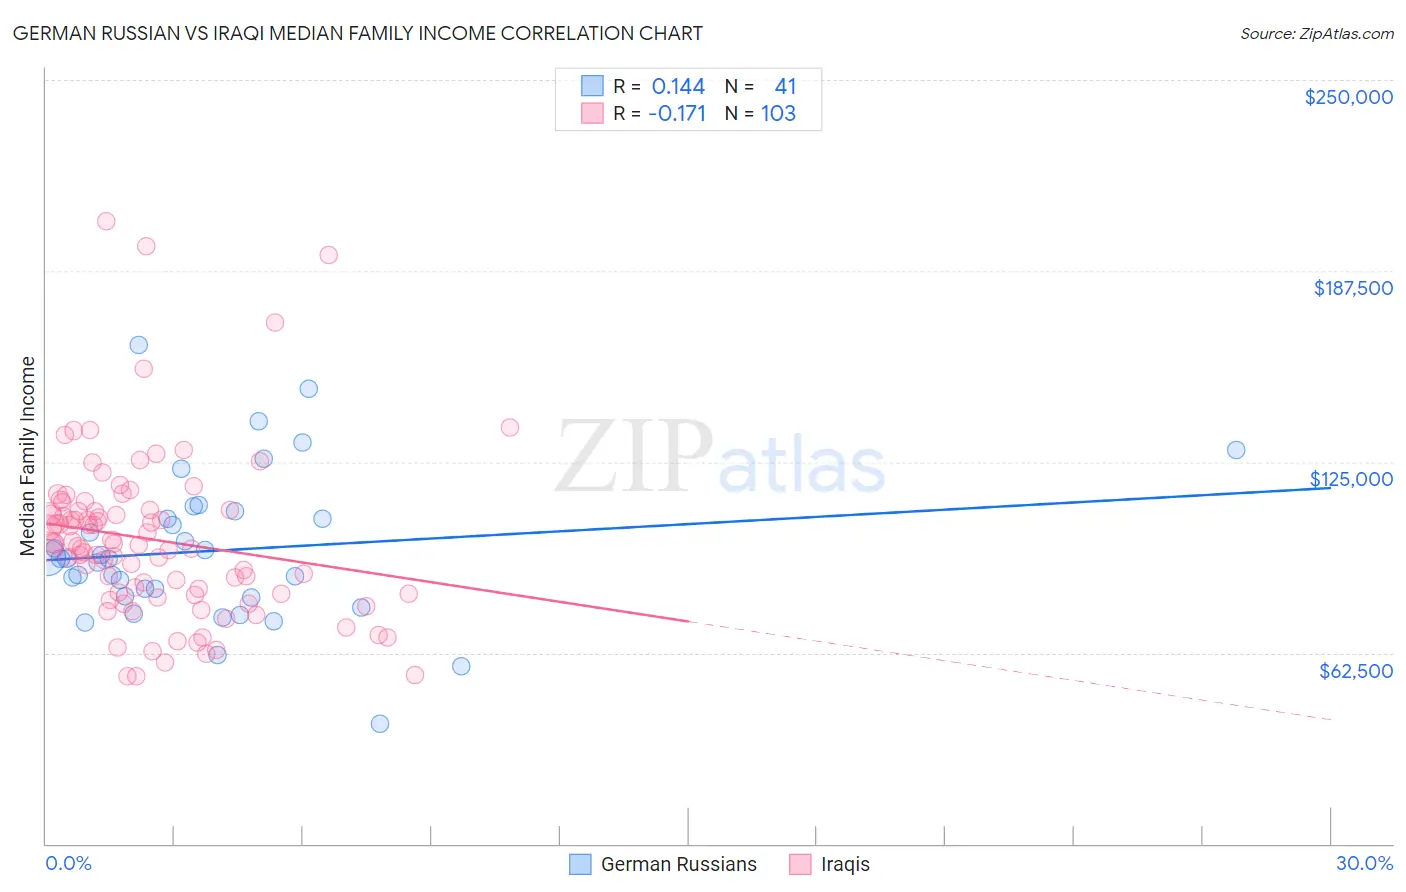
German Russian vs Iraqi Median Family Income Correlation Chart
The statistical analysis conducted on geographies consisting of 96,441,626 people shows a poor positive correlation between the proportion of German Russians and median family income in the United States with a correlation coefficient (R) of 0.144 and weighted average of $93,858. Similarly, the statistical analysis conducted on geographies consisting of 170,585,790 people shows a poor negative correlation between the proportion of Iraqis and median family income in the United States with a correlation coefficient (R) of -0.171 and weighted average of $100,658, a difference of 7.2%.
Median Family Income Correlation Summary
| Measurement | German Russian | Iraqi |
| Minimum | $39,167 | $54,690 |
| Maximum | $163,128 | $203,844 |
| Range | $123,961 | $149,154 |
| Mean | $95,905 | $99,589 |
| Median | $93,261 | $97,704 |
| Interquartile 25% (IQ1) | $80,798 | $81,823 |
| Interquartile 75% (IQ3) | $107,632 | $109,149 |
| Interquartile Range (IQR) | $26,834 | $27,326 |
| Standard Deviation (Sample) | $24,350 | $27,377 |
| Standard Deviation (Population) | $24,051 | $27,244 |
Similar Demographics by Median Family Income
Demographics Similar to German Russians by Median Family Income
In terms of median family income, the demographic groups most similar to German Russians are Barbadian ($93,919, a difference of 0.060%), Subsaharan African ($93,748, a difference of 0.12%), Immigrants from Trinidad and Tobago ($93,988, a difference of 0.14%), Somali ($94,085, a difference of 0.24%), and Salvadoran ($94,109, a difference of 0.27%).
| Demographics | Rating | Rank | Median Family Income |
| Trinidadians and Tobagonians | 1.5 /100 | #236 | Tragic $94,466 |
| Alaskan Athabascans | 1.5 /100 | #237 | Tragic $94,429 |
| Nepalese | 1.3 /100 | #238 | Tragic $94,153 |
| Salvadorans | 1.2 /100 | #239 | Tragic $94,109 |
| Somalis | 1.2 /100 | #240 | Tragic $94,085 |
| Immigrants | Trinidad and Tobago | 1.2 /100 | #241 | Tragic $93,988 |
| Barbadians | 1.1 /100 | #242 | Tragic $93,919 |
| German Russians | 1.1 /100 | #243 | Tragic $93,858 |
| Sub-Saharan Africans | 1.0 /100 | #244 | Tragic $93,748 |
| Immigrants | Middle Africa | 1.0 /100 | #245 | Tragic $93,593 |
| Guyanese | 0.9 /100 | #246 | Tragic $93,373 |
| Immigrants | Senegal | 0.7 /100 | #247 | Tragic $92,912 |
| French American Indians | 0.7 /100 | #248 | Tragic $92,872 |
| Immigrants | Ecuador | 0.7 /100 | #249 | Tragic $92,837 |
| West Indians | 0.6 /100 | #250 | Tragic $92,765 |
Demographics Similar to Iraqis by Median Family Income
In terms of median family income, the demographic groups most similar to Iraqis are Uruguayan ($100,656, a difference of 0.0%), Immigrants from Kenya ($100,679, a difference of 0.020%), Colombian ($100,750, a difference of 0.090%), Immigrants from South America ($100,414, a difference of 0.24%), and Immigrants ($100,962, a difference of 0.30%).
| Demographics | Rating | Rank | Median Family Income |
| Celtics | 31.3 /100 | #186 | Fair $101,139 |
| Tlingit-Haida | 30.8 /100 | #187 | Fair $101,092 |
| Guamanians/Chamorros | 30.5 /100 | #188 | Fair $101,061 |
| Immigrants | Portugal | 29.6 /100 | #189 | Fair $100,984 |
| Immigrants | Immigrants | 29.4 /100 | #190 | Fair $100,962 |
| Colombians | 27.2 /100 | #191 | Fair $100,750 |
| Immigrants | Kenya | 26.5 /100 | #192 | Fair $100,679 |
| Iraqis | 26.3 /100 | #193 | Fair $100,658 |
| Uruguayans | 26.3 /100 | #194 | Fair $100,656 |
| Immigrants | South America | 23.9 /100 | #195 | Fair $100,414 |
| Samoans | 23.3 /100 | #196 | Fair $100,344 |
| Immigrants | Cameroon | 22.8 /100 | #197 | Fair $100,289 |
| Immigrants | Africa | 22.5 /100 | #198 | Fair $100,256 |
| Yugoslavians | 21.3 /100 | #199 | Fair $100,119 |
| Spanish | 20.1 /100 | #200 | Fair $99,977 |