French vs Lithuanian Median Female Earnings
COMPARE
French
Lithuanian
Median Female Earnings
Median Female Earnings Comparison
French
Lithuanians
$38,457
MEDIAN FEMALE EARNINGS
7.0/ 100
METRIC RATING
225th/ 347
METRIC RANK
$42,108
MEDIAN FEMALE EARNINGS
99.3/ 100
METRIC RATING
87th/ 347
METRIC RANK
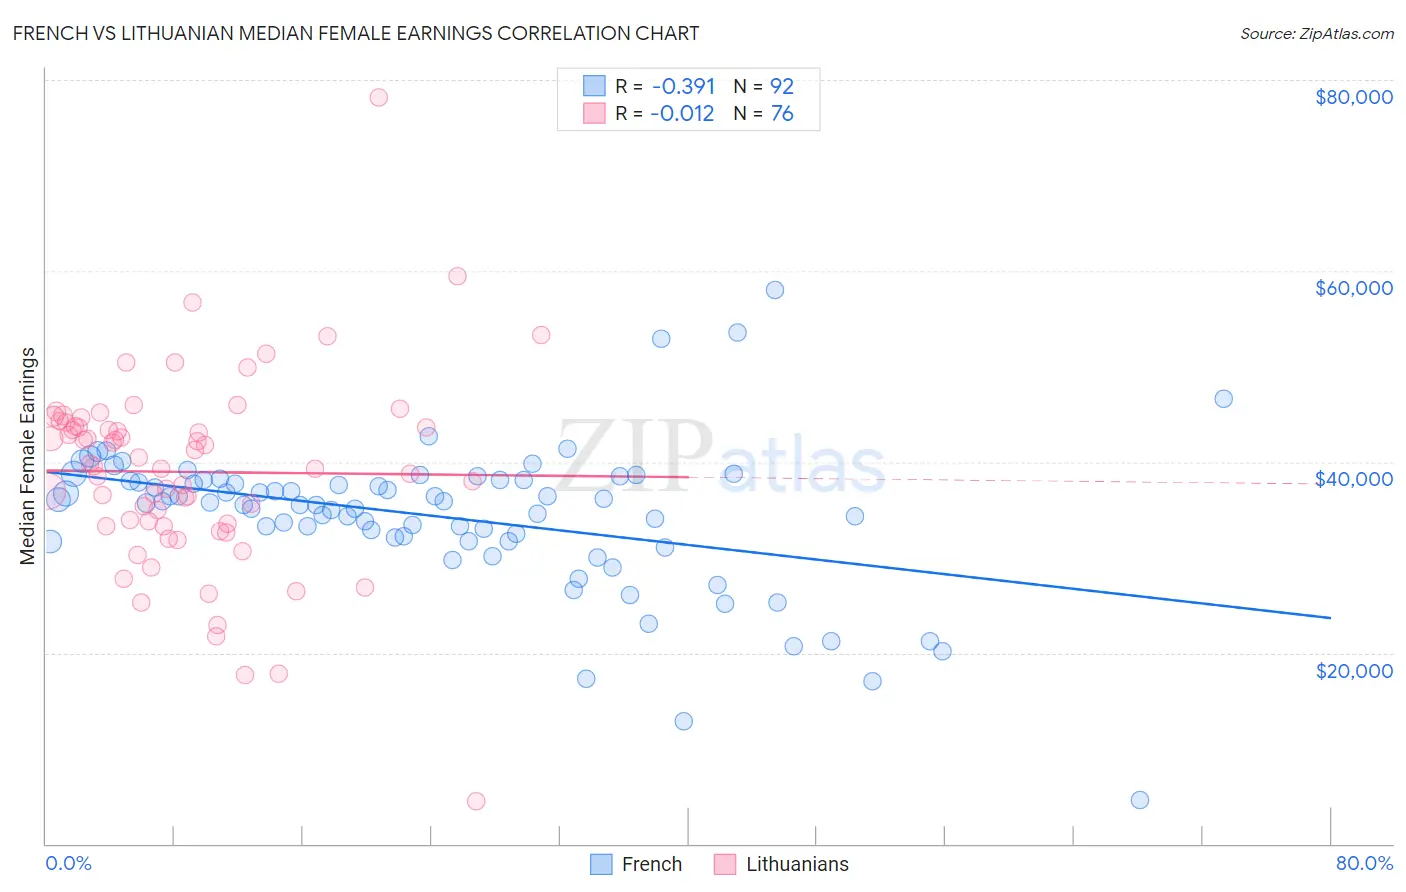
French vs Lithuanian Median Female Earnings Correlation Chart
The statistical analysis conducted on geographies consisting of 570,640,239 people shows a mild negative correlation between the proportion of French and median female earnings in the United States with a correlation coefficient (R) of -0.391 and weighted average of $38,457. Similarly, the statistical analysis conducted on geographies consisting of 421,690,318 people shows no correlation between the proportion of Lithuanians and median female earnings in the United States with a correlation coefficient (R) of -0.012 and weighted average of $42,108, a difference of 9.5%.
Median Female Earnings Correlation Summary
| Measurement | French | Lithuanian |
| Minimum | $4,625 | $4,435 |
| Maximum | $58,008 | $78,167 |
| Range | $53,383 | $73,732 |
| Mean | $34,289 | $38,946 |
| Median | $35,683 | $39,620 |
| Interquartile 25% (IQ1) | $31,891 | $33,413 |
| Interquartile 75% (IQ3) | $38,063 | $43,909 |
| Interquartile Range (IQR) | $6,171 | $10,496 |
| Standard Deviation (Sample) | $7,750 | $10,262 |
| Standard Deviation (Population) | $7,708 | $10,194 |
Similar Demographics by Median Female Earnings
Demographics Similar to French by Median Female Earnings
In terms of median female earnings, the demographic groups most similar to French are Native Hawaiian ($38,461, a difference of 0.010%), French Canadian ($38,436, a difference of 0.050%), Immigrants from Sudan ($38,511, a difference of 0.14%), Scottish ($38,397, a difference of 0.15%), and Subsaharan African ($38,391, a difference of 0.17%).
| Demographics | Rating | Rank | Median Female Earnings |
| Cape Verdeans | 9.5 /100 | #218 | Tragic $38,614 |
| Nepalese | 9.3 /100 | #219 | Tragic $38,603 |
| Yugoslavians | 8.8 /100 | #220 | Tragic $38,573 |
| Immigrants | Azores | 8.8 /100 | #221 | Tragic $38,573 |
| Japanese | 8.1 /100 | #222 | Tragic $38,528 |
| Immigrants | Sudan | 7.8 /100 | #223 | Tragic $38,511 |
| Native Hawaiians | 7.1 /100 | #224 | Tragic $38,461 |
| French | 7.0 /100 | #225 | Tragic $38,457 |
| French Canadians | 6.8 /100 | #226 | Tragic $38,436 |
| Scottish | 6.3 /100 | #227 | Tragic $38,397 |
| Sub-Saharan Africans | 6.2 /100 | #228 | Tragic $38,391 |
| Belgians | 6.1 /100 | #229 | Tragic $38,382 |
| Basques | 5.7 /100 | #230 | Tragic $38,352 |
| Somalis | 5.5 /100 | #231 | Tragic $38,333 |
| Scandinavians | 5.2 /100 | #232 | Tragic $38,306 |
Demographics Similar to Lithuanians by Median Female Earnings
In terms of median female earnings, the demographic groups most similar to Lithuanians are Immigrants from St. Vincent and the Grenadines ($42,108, a difference of 0.0%), Laotian ($42,133, a difference of 0.060%), Immigrants from Northern Africa ($42,084, a difference of 0.060%), Immigrants from Afghanistan ($42,055, a difference of 0.12%), and Ukrainian ($42,015, a difference of 0.22%).
| Demographics | Rating | Rank | Median Female Earnings |
| Immigrants | Moldova | 99.6 /100 | #80 | Exceptional $42,304 |
| Immigrants | Southern Europe | 99.5 /100 | #81 | Exceptional $42,275 |
| Immigrants | Morocco | 99.5 /100 | #82 | Exceptional $42,229 |
| Immigrants | Sierra Leone | 99.5 /100 | #83 | Exceptional $42,214 |
| Armenians | 99.5 /100 | #84 | Exceptional $42,212 |
| Laotians | 99.4 /100 | #85 | Exceptional $42,133 |
| Immigrants | St. Vincent and the Grenadines | 99.3 /100 | #86 | Exceptional $42,108 |
| Lithuanians | 99.3 /100 | #87 | Exceptional $42,108 |
| Immigrants | Northern Africa | 99.3 /100 | #88 | Exceptional $42,084 |
| Immigrants | Afghanistan | 99.3 /100 | #89 | Exceptional $42,055 |
| Ukrainians | 99.2 /100 | #90 | Exceptional $42,015 |
| Immigrants | Western Europe | 99.2 /100 | #91 | Exceptional $41,990 |
| Argentineans | 99.1 /100 | #92 | Exceptional $41,952 |
| Immigrants | Grenada | 99.0 /100 | #93 | Exceptional $41,932 |
| Moroccans | 98.9 /100 | #94 | Exceptional $41,872 |