French Canadian vs Lebanese Median Earnings
COMPARE
French Canadian
Lebanese
Median Earnings
Median Earnings Comparison
French Canadians
Lebanese
$46,026
MEDIAN EARNINGS
36.1/ 100
METRIC RATING
190th/ 347
METRIC RANK
$48,226
MEDIAN EARNINGS
92.5/ 100
METRIC RATING
131st/ 347
METRIC RANK
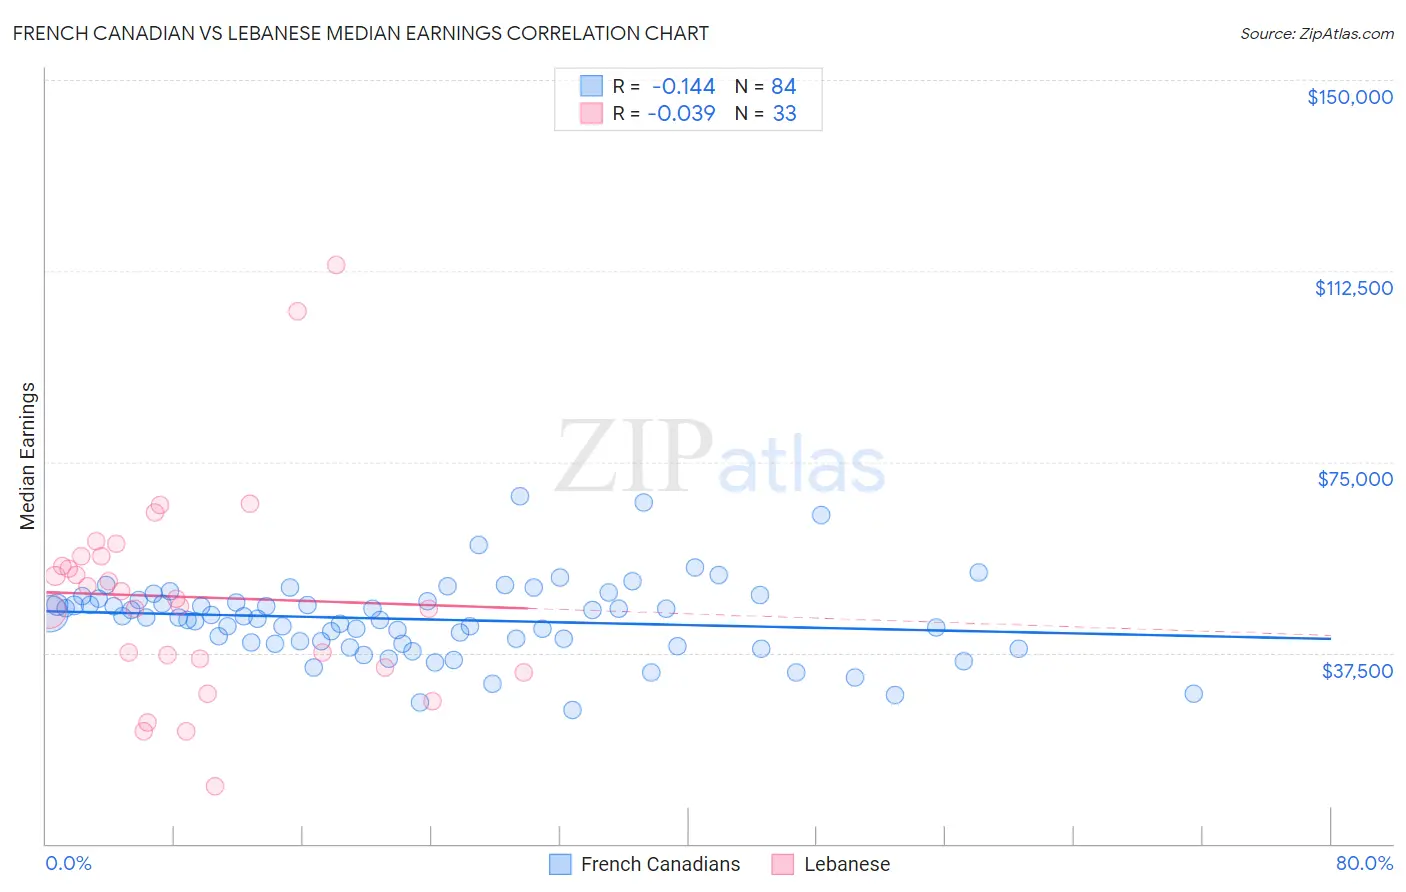
French Canadian vs Lebanese Median Earnings Correlation Chart
The statistical analysis conducted on geographies consisting of 502,564,111 people shows a poor negative correlation between the proportion of French Canadians and median earnings in the United States with a correlation coefficient (R) of -0.144 and weighted average of $46,026. Similarly, the statistical analysis conducted on geographies consisting of 401,606,109 people shows no correlation between the proportion of Lebanese and median earnings in the United States with a correlation coefficient (R) of -0.039 and weighted average of $48,226, a difference of 4.8%.
Median Earnings Correlation Summary
| Measurement | French Canadian | Lebanese |
| Minimum | $26,346 | $11,384 |
| Maximum | $68,284 | $113,646 |
| Range | $41,938 | $102,262 |
| Mean | $44,063 | $48,478 |
| Median | $44,489 | $48,125 |
| Interquartile 25% (IQ1) | $39,382 | $35,416 |
| Interquartile 75% (IQ3) | $47,671 | $56,506 |
| Interquartile Range (IQR) | $8,289 | $21,090 |
| Standard Deviation (Sample) | $7,666 | $20,869 |
| Standard Deviation (Population) | $7,620 | $20,550 |
Similar Demographics by Median Earnings
Demographics Similar to French Canadians by Median Earnings
In terms of median earnings, the demographic groups most similar to French Canadians are Spaniard ($46,059, a difference of 0.070%), Immigrants from Armenia ($46,094, a difference of 0.15%), Finnish ($45,940, a difference of 0.19%), German ($45,935, a difference of 0.20%), and Guamanian/Chamorro ($45,933, a difference of 0.20%).
| Demographics | Rating | Rank | Median Earnings |
| French | 45.2 /100 | #183 | Average $46,296 |
| Immigrants | Kenya | 42.4 /100 | #184 | Average $46,214 |
| Uruguayans | 41.6 /100 | #185 | Average $46,190 |
| Vietnamese | 40.9 /100 | #186 | Average $46,172 |
| Iraqis | 39.9 /100 | #187 | Fair $46,140 |
| Immigrants | Armenia | 38.3 /100 | #188 | Fair $46,094 |
| Spaniards | 37.2 /100 | #189 | Fair $46,059 |
| French Canadians | 36.1 /100 | #190 | Fair $46,026 |
| Finns | 33.4 /100 | #191 | Fair $45,940 |
| Germans | 33.2 /100 | #192 | Fair $45,935 |
| Guamanians/Chamorros | 33.2 /100 | #193 | Fair $45,933 |
| Immigrants | Costa Rica | 33.0 /100 | #194 | Fair $45,928 |
| Immigrants | St. Vincent and the Grenadines | 32.4 /100 | #195 | Fair $45,908 |
| Yugoslavians | 30.5 /100 | #196 | Fair $45,846 |
| Barbadians | 30.5 /100 | #197 | Fair $45,846 |
Demographics Similar to Lebanese by Median Earnings
In terms of median earnings, the demographic groups most similar to Lebanese are Zimbabwean ($48,229, a difference of 0.010%), Pakistani ($48,254, a difference of 0.060%), Immigrants from Philippines ($48,266, a difference of 0.080%), British ($48,189, a difference of 0.080%), and Sierra Leonean ($48,286, a difference of 0.12%).
| Demographics | Rating | Rank | Median Earnings |
| Brazilians | 93.7 /100 | #124 | Exceptional $48,356 |
| Immigrants | Fiji | 93.3 /100 | #125 | Exceptional $48,305 |
| Assyrians/Chaldeans/Syriacs | 93.3 /100 | #126 | Exceptional $48,304 |
| Sierra Leoneans | 93.1 /100 | #127 | Exceptional $48,286 |
| Immigrants | Philippines | 92.9 /100 | #128 | Exceptional $48,266 |
| Pakistanis | 92.8 /100 | #129 | Exceptional $48,254 |
| Zimbabweans | 92.6 /100 | #130 | Exceptional $48,229 |
| Lebanese | 92.5 /100 | #131 | Exceptional $48,226 |
| British | 92.2 /100 | #132 | Exceptional $48,189 |
| Immigrants | Uganda | 90.5 /100 | #133 | Exceptional $48,041 |
| Sri Lankans | 90.5 /100 | #134 | Exceptional $48,040 |
| Portuguese | 90.4 /100 | #135 | Exceptional $48,032 |
| Slovenes | 90.0 /100 | #136 | Excellent $47,995 |
| Immigrants | Nepal | 89.0 /100 | #137 | Excellent $47,925 |
| Europeans | 88.9 /100 | #138 | Excellent $47,915 |