French Canadian vs Immigrants from Zaire Median Family Income
COMPARE
French Canadian
Immigrants from Zaire
Median Family Income
Median Family Income Comparison
French Canadians
Immigrants from Zaire
$101,634
MEDIAN FAMILY INCOME
37.0/ 100
METRIC RATING
180th/ 347
METRIC RANK
$89,285
MEDIAN FAMILY INCOME
0.1/ 100
METRIC RATING
276th/ 347
METRIC RANK
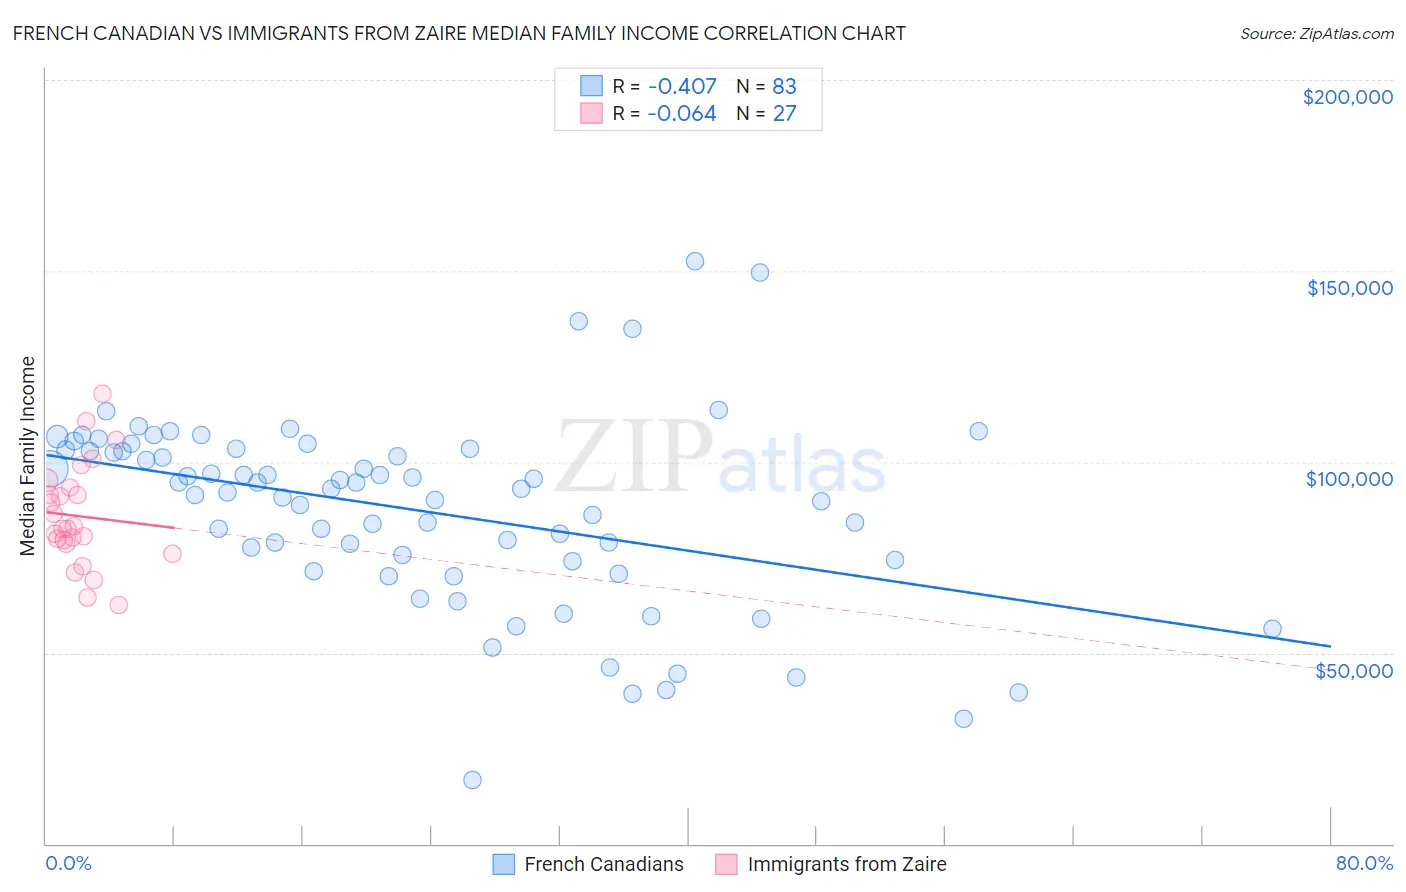
French Canadian vs Immigrants from Zaire Median Family Income Correlation Chart
The statistical analysis conducted on geographies consisting of 501,962,577 people shows a moderate negative correlation between the proportion of French Canadians and median family income in the United States with a correlation coefficient (R) of -0.407 and weighted average of $101,634. Similarly, the statistical analysis conducted on geographies consisting of 107,241,539 people shows a slight negative correlation between the proportion of Immigrants from Zaire and median family income in the United States with a correlation coefficient (R) of -0.064 and weighted average of $89,285, a difference of 13.8%.
Median Family Income Correlation Summary
| Measurement | French Canadian | Immigrants from Zaire |
| Minimum | $16,696 | $62,631 |
| Maximum | $152,574 | $117,948 |
| Range | $135,878 | $55,317 |
| Mean | $87,243 | $85,792 |
| Median | $92,910 | $82,545 |
| Interquartile 25% (IQ1) | $74,042 | $78,573 |
| Interquartile 75% (IQ3) | $103,222 | $93,272 |
| Interquartile Range (IQR) | $29,180 | $14,699 |
| Standard Deviation (Sample) | $24,938 | $13,444 |
| Standard Deviation (Population) | $24,788 | $13,193 |
Similar Demographics by Median Family Income
Demographics Similar to French Canadians by Median Family Income
In terms of median family income, the demographic groups most similar to French Canadians are Spaniard ($101,617, a difference of 0.020%), Tsimshian ($101,543, a difference of 0.090%), Kenyan ($101,417, a difference of 0.21%), South American ($101,856, a difference of 0.22%), and Immigrants from Costa Rica ($101,354, a difference of 0.28%).
| Demographics | Rating | Rank | Median Family Income |
| Belgians | 51.4 /100 | #173 | Average $102,788 |
| Finns | 50.0 /100 | #174 | Average $102,676 |
| Immigrants | Eastern Africa | 47.1 /100 | #175 | Average $102,451 |
| French | 46.1 /100 | #176 | Average $102,368 |
| Germans | 44.6 /100 | #177 | Average $102,254 |
| Welsh | 43.3 /100 | #178 | Average $102,151 |
| South Americans | 39.7 /100 | #179 | Fair $101,856 |
| French Canadians | 37.0 /100 | #180 | Fair $101,634 |
| Spaniards | 36.8 /100 | #181 | Fair $101,617 |
| Tsimshian | 35.9 /100 | #182 | Fair $101,543 |
| Kenyans | 34.5 /100 | #183 | Fair $101,417 |
| Immigrants | Costa Rica | 33.7 /100 | #184 | Fair $101,354 |
| Dutch | 31.9 /100 | #185 | Fair $101,192 |
| Celtics | 31.3 /100 | #186 | Fair $101,139 |
| Tlingit-Haida | 30.8 /100 | #187 | Fair $101,092 |
Demographics Similar to Immigrants from Zaire by Median Family Income
In terms of median family income, the demographic groups most similar to Immigrants from Zaire are Immigrants from Jamaica ($89,268, a difference of 0.020%), Immigrants from Grenada ($89,249, a difference of 0.040%), Immigrants from Belize ($89,197, a difference of 0.10%), British West Indian ($88,987, a difference of 0.33%), and Blackfeet ($88,717, a difference of 0.64%).
| Demographics | Rating | Rank | Median Family Income |
| Belizeans | 0.2 /100 | #269 | Tragic $90,880 |
| Jamaicans | 0.2 /100 | #270 | Tragic $90,581 |
| Iroquois | 0.2 /100 | #271 | Tragic $90,543 |
| Immigrants | Liberia | 0.2 /100 | #272 | Tragic $90,450 |
| Immigrants | Micronesia | 0.2 /100 | #273 | Tragic $90,345 |
| Spanish Americans | 0.2 /100 | #274 | Tragic $90,322 |
| Immigrants | St. Vincent and the Grenadines | 0.2 /100 | #275 | Tragic $90,094 |
| Immigrants | Zaire | 0.1 /100 | #276 | Tragic $89,285 |
| Immigrants | Jamaica | 0.1 /100 | #277 | Tragic $89,268 |
| Immigrants | Grenada | 0.1 /100 | #278 | Tragic $89,249 |
| Immigrants | Belize | 0.1 /100 | #279 | Tragic $89,197 |
| British West Indians | 0.1 /100 | #280 | Tragic $88,987 |
| Blackfeet | 0.1 /100 | #281 | Tragic $88,717 |
| Comanche | 0.1 /100 | #282 | Tragic $88,556 |
| Bangladeshis | 0.1 /100 | #283 | Tragic $88,358 |