French American Indian vs Venezuelan Median Female Earnings
COMPARE
French American Indian
Venezuelan
Median Female Earnings
Median Female Earnings Comparison
French American Indians
Venezuelans
$36,920
MEDIAN FEMALE EARNINGS
0.3/ 100
METRIC RATING
270th/ 347
METRIC RANK
$37,282
MEDIAN FEMALE EARNINGS
0.7/ 100
METRIC RATING
262nd/ 347
METRIC RANK
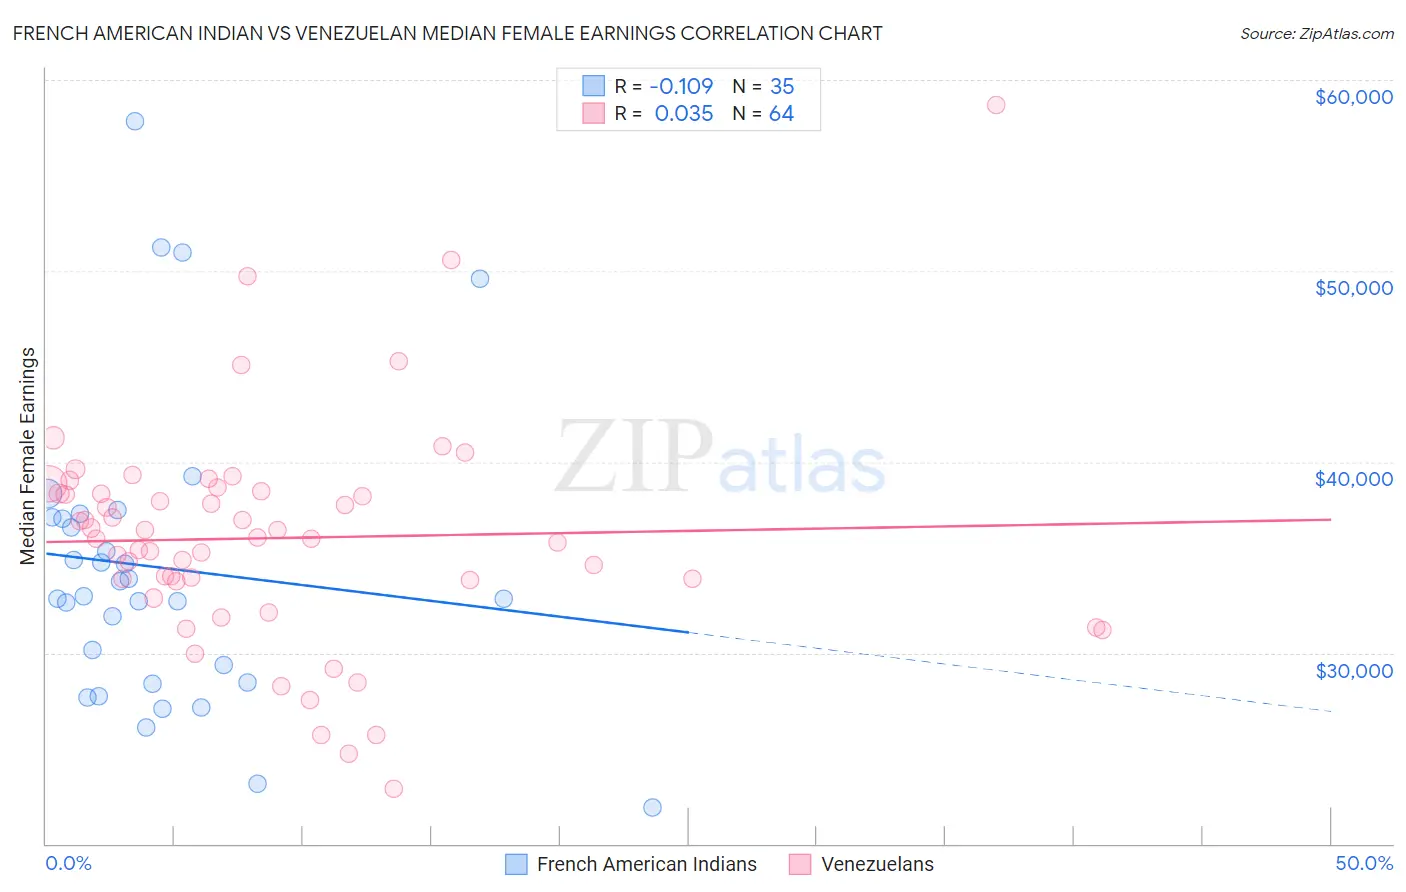
French American Indian vs Venezuelan Median Female Earnings Correlation Chart
The statistical analysis conducted on geographies consisting of 131,945,906 people shows a poor negative correlation between the proportion of French American Indians and median female earnings in the United States with a correlation coefficient (R) of -0.109 and weighted average of $36,920. Similarly, the statistical analysis conducted on geographies consisting of 306,258,851 people shows no correlation between the proportion of Venezuelans and median female earnings in the United States with a correlation coefficient (R) of 0.035 and weighted average of $37,282, a difference of 0.98%.
Median Female Earnings Correlation Summary
| Measurement | French American Indian | Venezuelan |
| Minimum | $21,875 | $22,864 |
| Maximum | $57,813 | $58,709 |
| Range | $35,938 | $35,845 |
| Mean | $34,449 | $36,013 |
| Median | $32,961 | $36,008 |
| Interquartile 25% (IQ1) | $28,438 | $33,765 |
| Interquartile 75% (IQ3) | $37,095 | $38,398 |
| Interquartile Range (IQR) | $8,657 | $4,633 |
| Standard Deviation (Sample) | $7,858 | $5,910 |
| Standard Deviation (Population) | $7,745 | $5,863 |
Demographics Similar to French American Indians and Venezuelans by Median Female Earnings
In terms of median female earnings, the demographic groups most similar to French American Indians are Nicaraguan ($36,904, a difference of 0.040%), Immigrants from Dominican Republic ($36,857, a difference of 0.17%), Immigrants from Laos ($36,841, a difference of 0.21%), Immigrants from Venezuela ($37,003, a difference of 0.23%), and Cree ($37,018, a difference of 0.27%). Similarly, the demographic groups most similar to Venezuelans are Malaysian ($37,298, a difference of 0.040%), Dutch ($37,339, a difference of 0.15%), Scotch-Irish ($37,383, a difference of 0.27%), Belizean ($37,429, a difference of 0.39%), and German Russian ($37,105, a difference of 0.48%).
| Demographics | Rating | Rank | Median Female Earnings |
| Samoans | 1.0 /100 | #256 | Tragic $37,498 |
| Hawaiians | 1.0 /100 | #257 | Tragic $37,497 |
| Belizeans | 0.9 /100 | #258 | Tragic $37,429 |
| Scotch-Irish | 0.8 /100 | #259 | Tragic $37,383 |
| Dutch | 0.7 /100 | #260 | Tragic $37,339 |
| Malaysians | 0.7 /100 | #261 | Tragic $37,298 |
| Venezuelans | 0.7 /100 | #262 | Tragic $37,282 |
| German Russians | 0.5 /100 | #263 | Tragic $37,105 |
| Salvadorans | 0.4 /100 | #264 | Tragic $37,083 |
| Immigrants | Belize | 0.4 /100 | #265 | Tragic $37,056 |
| Dominicans | 0.4 /100 | #266 | Tragic $37,046 |
| Immigrants | Nonimmigrants | 0.4 /100 | #267 | Tragic $37,024 |
| Cree | 0.4 /100 | #268 | Tragic $37,018 |
| Immigrants | Venezuela | 0.4 /100 | #269 | Tragic $37,003 |
| French American Indians | 0.3 /100 | #270 | Tragic $36,920 |
| Nicaraguans | 0.3 /100 | #271 | Tragic $36,904 |
| Immigrants | Dominican Republic | 0.3 /100 | #272 | Tragic $36,857 |
| Immigrants | Laos | 0.3 /100 | #273 | Tragic $36,841 |
| Immigrants | El Salvador | 0.2 /100 | #274 | Tragic $36,673 |
| Africans | 0.1 /100 | #275 | Tragic $36,530 |
| Central Americans | 0.1 /100 | #276 | Tragic $36,492 |