French American Indian vs Immigrants from Ukraine Median Household Income
COMPARE
French American Indian
Immigrants from Ukraine
Median Household Income
Median Household Income Comparison
French American Indians
Immigrants from Ukraine
$76,387
MEDIAN HOUSEHOLD INCOME
0.4/ 100
METRIC RATING
262nd/ 347
METRIC RANK
$91,124
MEDIAN HOUSEHOLD INCOME
98.0/ 100
METRIC RATING
103rd/ 347
METRIC RANK
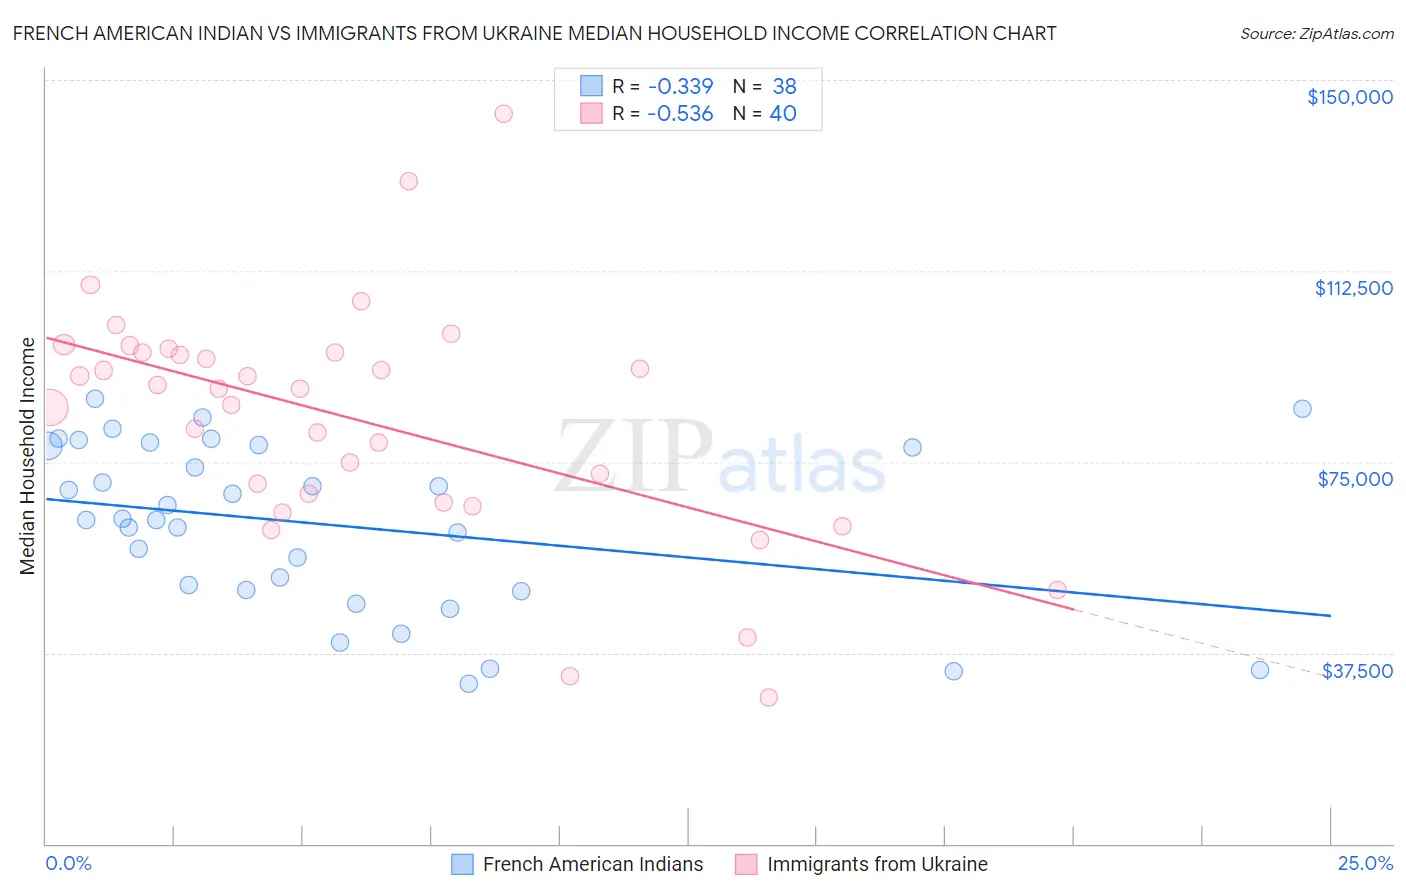
French American Indian vs Immigrants from Ukraine Median Household Income Correlation Chart
The statistical analysis conducted on geographies consisting of 131,952,383 people shows a mild negative correlation between the proportion of French American Indians and median household income in the United States with a correlation coefficient (R) of -0.339 and weighted average of $76,387. Similarly, the statistical analysis conducted on geographies consisting of 289,588,656 people shows a substantial negative correlation between the proportion of Immigrants from Ukraine and median household income in the United States with a correlation coefficient (R) of -0.536 and weighted average of $91,124, a difference of 19.3%.
Median Household Income Correlation Summary
| Measurement | French American Indian | Immigrants from Ukraine |
| Minimum | $31,325 | $28,750 |
| Maximum | $87,295 | $143,440 |
| Range | $55,970 | $114,690 |
| Mean | $62,652 | $83,370 |
| Median | $63,795 | $89,400 |
| Interquartile 25% (IQ1) | $49,785 | $67,859 |
| Interquartile 75% (IQ3) | $78,132 | $96,595 |
| Interquartile Range (IQR) | $28,346 | $28,737 |
| Standard Deviation (Sample) | $16,205 | $23,179 |
| Standard Deviation (Population) | $15,990 | $22,887 |
Similar Demographics by Median Household Income
Demographics Similar to French American Indians by Median Household Income
In terms of median household income, the demographic groups most similar to French American Indians are Alaskan Athabascan ($76,383, a difference of 0.010%), Immigrants from Grenada ($76,517, a difference of 0.17%), Jamaican ($76,583, a difference of 0.26%), Spanish American Indian ($76,670, a difference of 0.37%), and Immigrants from Nicaragua ($76,784, a difference of 0.52%).
| Demographics | Rating | Rank | Median Household Income |
| Immigrants | Middle Africa | 0.8 /100 | #255 | Tragic $77,559 |
| Belizeans | 0.6 /100 | #256 | Tragic $77,028 |
| Immigrants | Senegal | 0.5 /100 | #257 | Tragic $76,915 |
| Immigrants | Nicaragua | 0.5 /100 | #258 | Tragic $76,784 |
| Spanish American Indians | 0.4 /100 | #259 | Tragic $76,670 |
| Jamaicans | 0.4 /100 | #260 | Tragic $76,583 |
| Immigrants | Grenada | 0.4 /100 | #261 | Tragic $76,517 |
| French American Indians | 0.4 /100 | #262 | Tragic $76,387 |
| Alaskan Athabascans | 0.4 /100 | #263 | Tragic $76,383 |
| Guatemalans | 0.3 /100 | #264 | Tragic $75,961 |
| Immigrants | Belize | 0.3 /100 | #265 | Tragic $75,938 |
| Americans | 0.3 /100 | #266 | Tragic $75,932 |
| German Russians | 0.3 /100 | #267 | Tragic $75,856 |
| Immigrants | Jamaica | 0.3 /100 | #268 | Tragic $75,851 |
| Cape Verdeans | 0.3 /100 | #269 | Tragic $75,848 |
Demographics Similar to Immigrants from Ukraine by Median Household Income
In terms of median household income, the demographic groups most similar to Immigrants from Ukraine are Immigrants from Kazakhstan ($91,015, a difference of 0.12%), Austrian ($91,339, a difference of 0.24%), Immigrants from Brazil ($90,907, a difference of 0.24%), Immigrants from Moldova ($91,446, a difference of 0.35%), and Ukrainian ($91,456, a difference of 0.36%).
| Demographics | Rating | Rank | Median Household Income |
| Jordanians | 98.7 /100 | #96 | Exceptional $91,794 |
| Immigrants | Serbia | 98.6 /100 | #97 | Exceptional $91,730 |
| Immigrants | Southern Europe | 98.5 /100 | #98 | Exceptional $91,605 |
| Immigrants | South Eastern Asia | 98.4 /100 | #99 | Exceptional $91,541 |
| Ukrainians | 98.3 /100 | #100 | Exceptional $91,456 |
| Immigrants | Moldova | 98.3 /100 | #101 | Exceptional $91,446 |
| Austrians | 98.2 /100 | #102 | Exceptional $91,339 |
| Immigrants | Ukraine | 98.0 /100 | #103 | Exceptional $91,124 |
| Immigrants | Kazakhstan | 97.8 /100 | #104 | Exceptional $91,015 |
| Immigrants | Brazil | 97.7 /100 | #105 | Exceptional $90,907 |
| Macedonians | 97.4 /100 | #106 | Exceptional $90,761 |
| Croatians | 97.3 /100 | #107 | Exceptional $90,685 |
| Zimbabweans | 97.2 /100 | #108 | Exceptional $90,618 |
| Chileans | 97.2 /100 | #109 | Exceptional $90,605 |
| Palestinians | 97.1 /100 | #110 | Exceptional $90,574 |