French American Indian vs Immigrants from Eastern Europe Householder Income Under 25 years
COMPARE
French American Indian
Immigrants from Eastern Europe
Householder Income Under 25 years
Householder Income Under 25 years Comparison
French American Indians
Immigrants from Eastern Europe
$48,977
HOUSEHOLDER INCOME UNDER 25 YEARS
0.0/ 100
METRIC RATING
286th/ 347
METRIC RANK
$55,572
HOUSEHOLDER INCOME UNDER 25 YEARS
100.0/ 100
METRIC RATING
46th/ 347
METRIC RANK
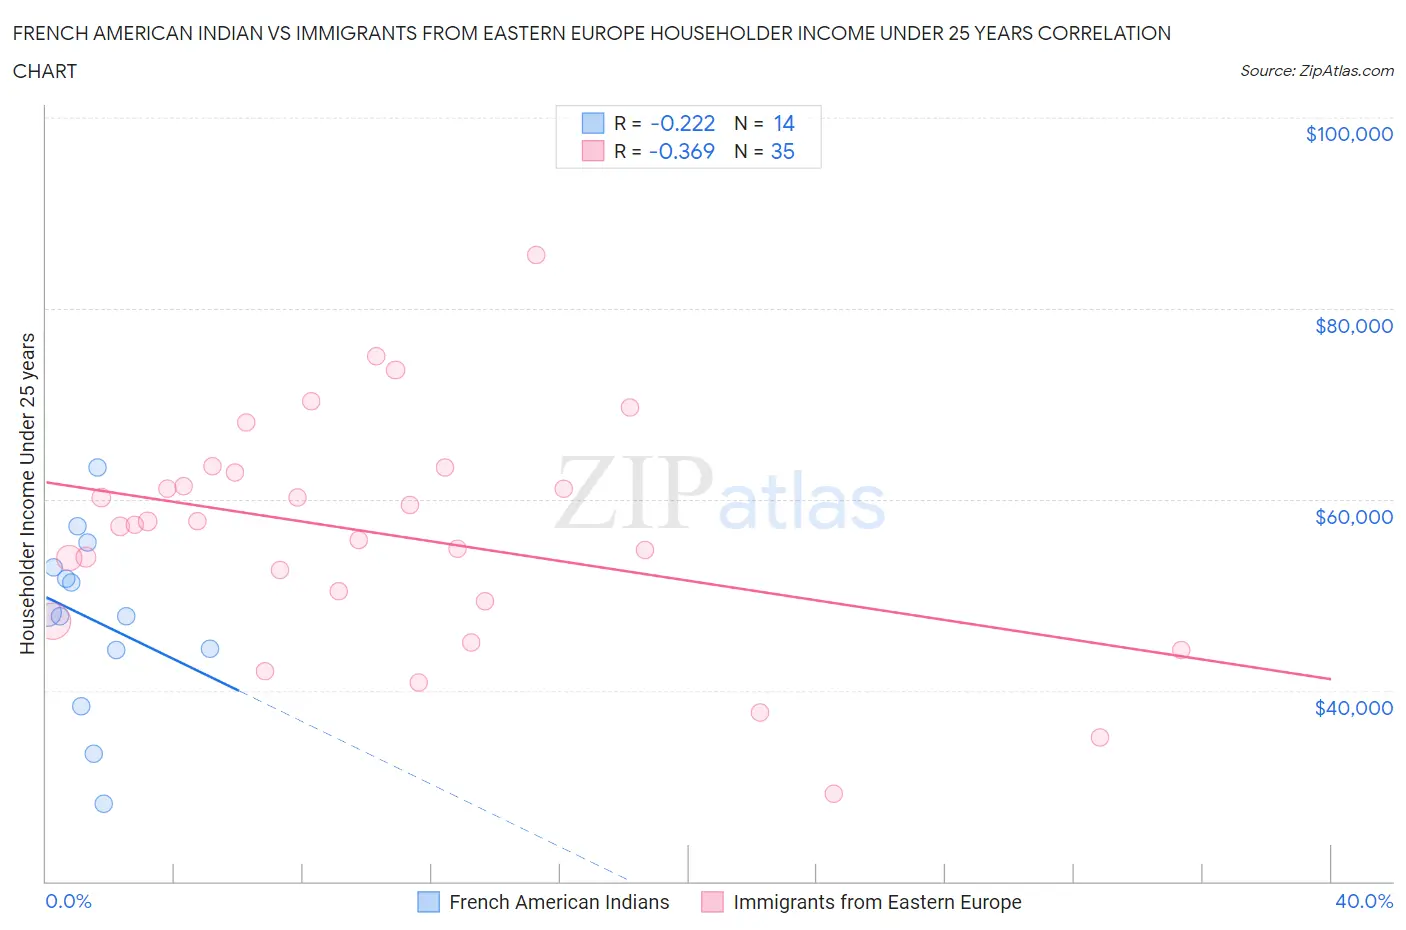
French American Indian vs Immigrants from Eastern Europe Householder Income Under 25 years Correlation Chart
The statistical analysis conducted on geographies consisting of 121,781,393 people shows a weak negative correlation between the proportion of French American Indians and household income with householder under the age of 25 in the United States with a correlation coefficient (R) of -0.222 and weighted average of $48,977. Similarly, the statistical analysis conducted on geographies consisting of 385,994,970 people shows a mild negative correlation between the proportion of Immigrants from Eastern Europe and household income with householder under the age of 25 in the United States with a correlation coefficient (R) of -0.369 and weighted average of $55,572, a difference of 13.5%.
Householder Income Under 25 years Correlation Summary
| Measurement | French American Indian | Immigrants from Eastern Europe |
| Minimum | $28,139 | $29,167 |
| Maximum | $63,296 | $85,625 |
| Range | $35,157 | $56,458 |
| Mean | $47,414 | $56,328 |
| Median | $47,997 | $57,373 |
| Interquartile 25% (IQ1) | $44,202 | $49,266 |
| Interquartile 75% (IQ3) | $52,866 | $62,778 |
| Interquartile Range (IQR) | $8,663 | $13,512 |
| Standard Deviation (Sample) | $9,404 | $11,797 |
| Standard Deviation (Population) | $9,062 | $11,627 |
Similar Demographics by Householder Income Under 25 years
Demographics Similar to French American Indians by Householder Income Under 25 years
In terms of householder income under 25 years, the demographic groups most similar to French American Indians are Senegalese ($48,953, a difference of 0.050%), Liberian ($48,917, a difference of 0.12%), Scotch-Irish ($49,039, a difference of 0.13%), Honduran ($48,885, a difference of 0.19%), and American ($48,860, a difference of 0.24%).
| Demographics | Rating | Rank | Householder Income Under 25 years |
| Apache | 0.1 /100 | #279 | Tragic $49,395 |
| Hmong | 0.1 /100 | #280 | Tragic $49,364 |
| Immigrants | Nonimmigrants | 0.1 /100 | #281 | Tragic $49,348 |
| Alsatians | 0.1 /100 | #282 | Tragic $49,267 |
| Immigrants | Nigeria | 0.1 /100 | #283 | Tragic $49,174 |
| Carpatho Rusyns | 0.1 /100 | #284 | Tragic $49,113 |
| Scotch-Irish | 0.0 /100 | #285 | Tragic $49,039 |
| French American Indians | 0.0 /100 | #286 | Tragic $48,977 |
| Senegalese | 0.0 /100 | #287 | Tragic $48,953 |
| Liberians | 0.0 /100 | #288 | Tragic $48,917 |
| Hondurans | 0.0 /100 | #289 | Tragic $48,885 |
| Americans | 0.0 /100 | #290 | Tragic $48,860 |
| Immigrants | Burma/Myanmar | 0.0 /100 | #291 | Tragic $48,749 |
| Shoshone | 0.0 /100 | #292 | Tragic $48,720 |
| Sub-Saharan Africans | 0.0 /100 | #293 | Tragic $48,691 |
Demographics Similar to Immigrants from Eastern Europe by Householder Income Under 25 years
In terms of householder income under 25 years, the demographic groups most similar to Immigrants from Eastern Europe are Spanish American Indian ($55,573, a difference of 0.0%), Cambodian ($55,571, a difference of 0.0%), Immigrants from Vietnam ($55,562, a difference of 0.020%), Iranian ($55,548, a difference of 0.040%), and Puget Sound Salish ($55,543, a difference of 0.050%).
| Demographics | Rating | Rank | Householder Income Under 25 years |
| Immigrants | Belarus | 100.0 /100 | #39 | Exceptional $55,743 |
| Immigrants | Greece | 100.0 /100 | #40 | Exceptional $55,727 |
| Immigrants | Guyana | 100.0 /100 | #41 | Exceptional $55,726 |
| Immigrants | Korea | 100.0 /100 | #42 | Exceptional $55,716 |
| Immigrants | South Eastern Asia | 100.0 /100 | #43 | Exceptional $55,714 |
| Paraguayans | 100.0 /100 | #44 | Exceptional $55,614 |
| Spanish American Indians | 100.0 /100 | #45 | Exceptional $55,573 |
| Immigrants | Eastern Europe | 100.0 /100 | #46 | Exceptional $55,572 |
| Cambodians | 100.0 /100 | #47 | Exceptional $55,571 |
| Immigrants | Vietnam | 100.0 /100 | #48 | Exceptional $55,562 |
| Iranians | 100.0 /100 | #49 | Exceptional $55,548 |
| Puget Sound Salish | 100.0 /100 | #50 | Exceptional $55,543 |
| Immigrants | Romania | 100.0 /100 | #51 | Exceptional $55,522 |
| Immigrants | Indonesia | 100.0 /100 | #52 | Exceptional $55,521 |
| Immigrants | Poland | 100.0 /100 | #53 | Exceptional $55,474 |