Filipino vs Asian Median Male Earnings
COMPARE
Filipino
Asian
Median Male Earnings
Median Male Earnings Comparison
Filipinos
Asians
$74,224
MEDIAN MALE EARNINGS
100.0/ 100
METRIC RATING
1st/ 347
METRIC RANK
$63,827
MEDIAN MALE EARNINGS
100.0/ 100
METRIC RATING
29th/ 347
METRIC RANK
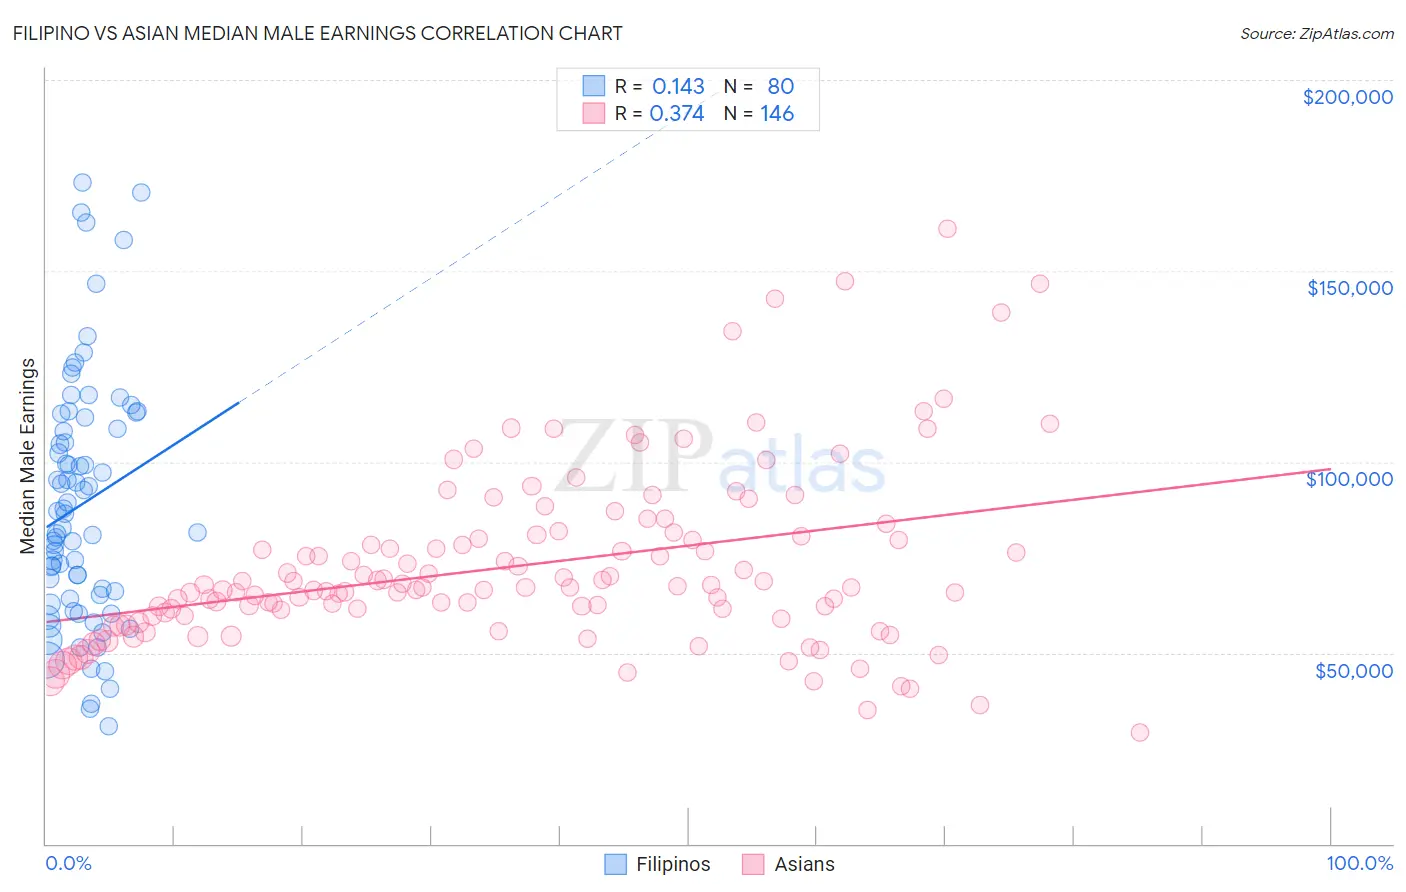
Filipino vs Asian Median Male Earnings Correlation Chart
The statistical analysis conducted on geographies consisting of 254,342,119 people shows a poor positive correlation between the proportion of Filipinos and median male earnings in the United States with a correlation coefficient (R) of 0.143 and weighted average of $74,224. Similarly, the statistical analysis conducted on geographies consisting of 550,236,506 people shows a mild positive correlation between the proportion of Asians and median male earnings in the United States with a correlation coefficient (R) of 0.374 and weighted average of $63,827, a difference of 16.3%.
Median Male Earnings Correlation Summary
| Measurement | Filipino | Asian |
| Minimum | $30,694 | $29,236 |
| Maximum | $173,150 | $160,917 |
| Range | $142,456 | $131,681 |
| Mean | $88,887 | $72,799 |
| Median | $84,592 | $67,194 |
| Interquartile 25% (IQ1) | $64,781 | $59,553 |
| Interquartile 75% (IQ3) | $110,251 | $80,527 |
| Interquartile Range (IQR) | $45,470 | $20,975 |
| Standard Deviation (Sample) | $32,365 | $23,189 |
| Standard Deviation (Population) | $32,162 | $23,109 |
Similar Demographics by Median Male Earnings
Demographics Similar to Filipinos by Median Male Earnings
In terms of median male earnings, the demographic groups most similar to Filipinos are Immigrants from India ($74,207, a difference of 0.020%), Immigrants from Taiwan ($74,031, a difference of 0.26%), Thai ($72,135, a difference of 2.9%), Immigrants from Singapore ($71,348, a difference of 4.0%), and Iranian ($70,648, a difference of 5.1%).
| Demographics | Rating | Rank | Median Male Earnings |
| Filipinos | 100.0 /100 | #1 | Exceptional $74,224 |
| Immigrants | India | 100.0 /100 | #2 | Exceptional $74,207 |
| Immigrants | Taiwan | 100.0 /100 | #3 | Exceptional $74,031 |
| Thais | 100.0 /100 | #4 | Exceptional $72,135 |
| Immigrants | Singapore | 100.0 /100 | #5 | Exceptional $71,348 |
| Iranians | 100.0 /100 | #6 | Exceptional $70,648 |
| Immigrants | Hong Kong | 100.0 /100 | #7 | Exceptional $70,146 |
| Immigrants | Iran | 100.0 /100 | #8 | Exceptional $69,284 |
| Immigrants | South Central Asia | 100.0 /100 | #9 | Exceptional $68,960 |
| Immigrants | Israel | 100.0 /100 | #10 | Exceptional $68,716 |
| Immigrants | Ireland | 100.0 /100 | #11 | Exceptional $67,698 |
| Immigrants | Australia | 100.0 /100 | #12 | Exceptional $67,634 |
| Immigrants | China | 100.0 /100 | #13 | Exceptional $67,353 |
| Okinawans | 100.0 /100 | #14 | Exceptional $67,232 |
| Immigrants | Eastern Asia | 100.0 /100 | #15 | Exceptional $66,903 |
Demographics Similar to Asians by Median Male Earnings
In terms of median male earnings, the demographic groups most similar to Asians are Russian ($63,939, a difference of 0.17%), Immigrants from Switzerland ($63,944, a difference of 0.18%), Immigrants from France ($63,715, a difference of 0.18%), Latvian ($63,498, a difference of 0.52%), and Turkish ($64,253, a difference of 0.67%).
| Demographics | Rating | Rank | Median Male Earnings |
| Burmese | 100.0 /100 | #22 | Exceptional $65,236 |
| Immigrants | Korea | 100.0 /100 | #23 | Exceptional $65,079 |
| Immigrants | Northern Europe | 100.0 /100 | #24 | Exceptional $64,987 |
| Immigrants | Denmark | 100.0 /100 | #25 | Exceptional $64,625 |
| Turks | 100.0 /100 | #26 | Exceptional $64,253 |
| Immigrants | Switzerland | 100.0 /100 | #27 | Exceptional $63,944 |
| Russians | 100.0 /100 | #28 | Exceptional $63,939 |
| Asians | 100.0 /100 | #29 | Exceptional $63,827 |
| Immigrants | France | 100.0 /100 | #30 | Exceptional $63,715 |
| Latvians | 100.0 /100 | #31 | Exceptional $63,498 |
| Soviet Union | 100.0 /100 | #32 | Exceptional $63,382 |
| Immigrants | Lithuania | 100.0 /100 | #33 | Exceptional $63,346 |
| Immigrants | Russia | 100.0 /100 | #34 | Exceptional $63,326 |
| Immigrants | Asia | 100.0 /100 | #35 | Exceptional $63,240 |
| Israelis | 100.0 /100 | #36 | Exceptional $63,228 |