Fijian vs Okinawan Median Family Income
COMPARE
Fijian
Okinawan
Median Family Income
Median Family Income Comparison
Fijians
Okinawans
$87,387
MEDIAN FAMILY INCOME
0.0/ 100
METRIC RATING
294th/ 347
METRIC RANK
$129,979
MEDIAN FAMILY INCOME
100.0/ 100
METRIC RATING
9th/ 347
METRIC RANK
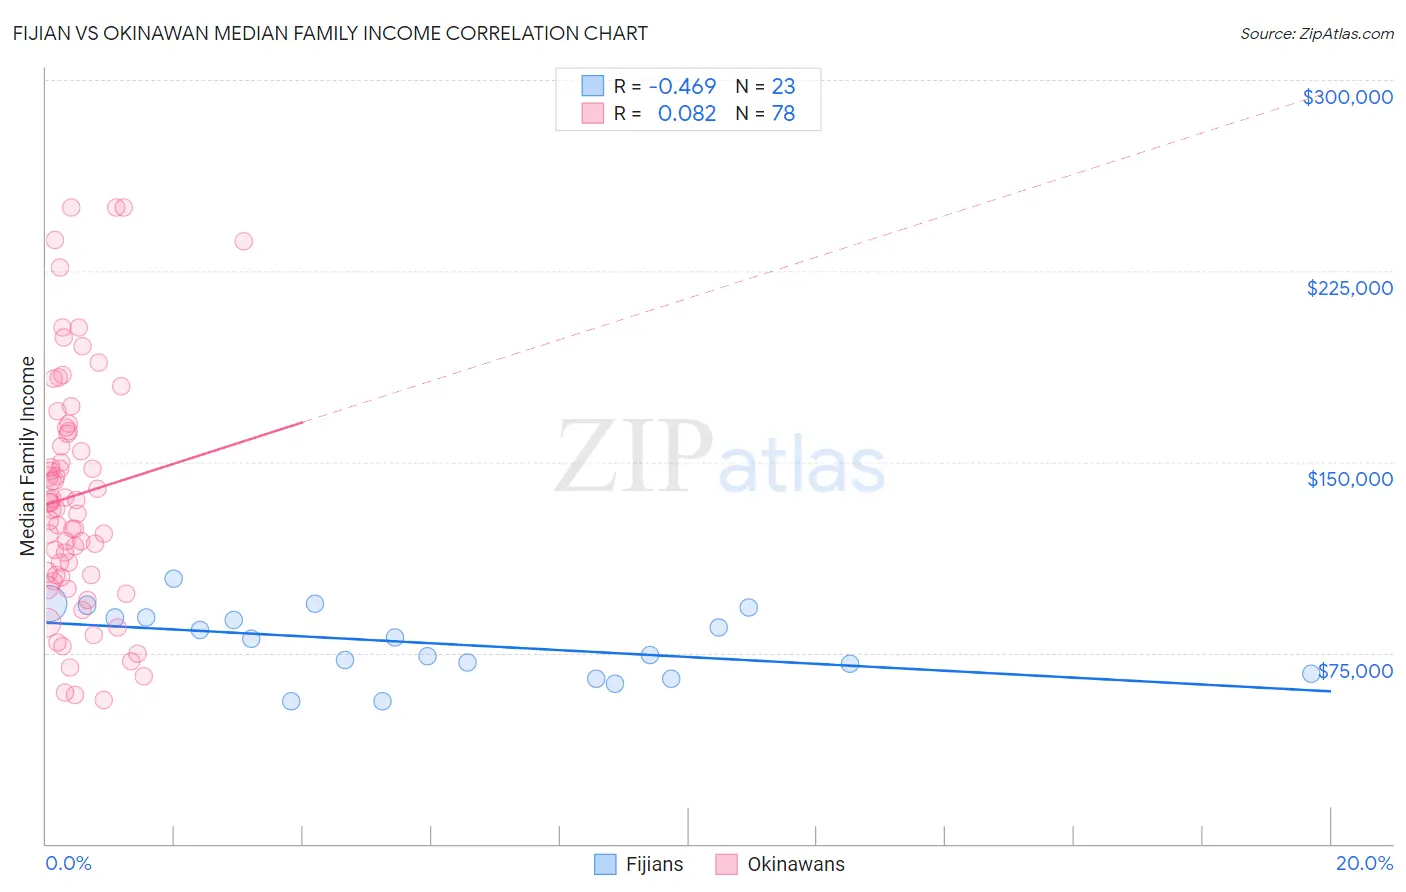
Fijian vs Okinawan Median Family Income Correlation Chart
The statistical analysis conducted on geographies consisting of 55,946,812 people shows a moderate negative correlation between the proportion of Fijians and median family income in the United States with a correlation coefficient (R) of -0.469 and weighted average of $87,387. Similarly, the statistical analysis conducted on geographies consisting of 73,711,216 people shows a slight positive correlation between the proportion of Okinawans and median family income in the United States with a correlation coefficient (R) of 0.082 and weighted average of $129,979, a difference of 48.7%.
Median Family Income Correlation Summary
| Measurement | Fijian | Okinawan |
| Minimum | $55,821 | $56,429 |
| Maximum | $104,335 | $250,001 |
| Range | $48,514 | $193,572 |
| Mean | $78,636 | $136,798 |
| Median | $80,363 | $132,761 |
| Interquartile 25% (IQ1) | $66,750 | $105,402 |
| Interquartile 75% (IQ3) | $89,066 | $161,875 |
| Interquartile Range (IQR) | $22,316 | $56,473 |
| Standard Deviation (Sample) | $13,442 | $46,889 |
| Standard Deviation (Population) | $13,146 | $46,587 |
Similar Demographics by Median Family Income
Demographics Similar to Fijians by Median Family Income
In terms of median family income, the demographic groups most similar to Fijians are Yaqui ($87,289, a difference of 0.11%), Immigrants from Guatemala ($87,191, a difference of 0.22%), Ute ($87,596, a difference of 0.24%), Cajun ($87,157, a difference of 0.26%), and Immigrants from Latin America ($86,989, a difference of 0.46%).
| Demographics | Rating | Rank | Median Family Income |
| Potawatomi | 0.1 /100 | #287 | Tragic $88,265 |
| Cherokee | 0.1 /100 | #288 | Tragic $88,209 |
| Central American Indians | 0.1 /100 | #289 | Tragic $88,034 |
| Shoshone | 0.1 /100 | #290 | Tragic $87,872 |
| Immigrants | Cabo Verde | 0.1 /100 | #291 | Tragic $87,830 |
| Africans | 0.1 /100 | #292 | Tragic $87,820 |
| Ute | 0.0 /100 | #293 | Tragic $87,596 |
| Fijians | 0.0 /100 | #294 | Tragic $87,387 |
| Yaqui | 0.0 /100 | #295 | Tragic $87,289 |
| Immigrants | Guatemala | 0.0 /100 | #296 | Tragic $87,191 |
| Cajuns | 0.0 /100 | #297 | Tragic $87,157 |
| Immigrants | Latin America | 0.0 /100 | #298 | Tragic $86,989 |
| Chippewa | 0.0 /100 | #299 | Tragic $86,852 |
| Ottawa | 0.0 /100 | #300 | Tragic $86,380 |
| Colville | 0.0 /100 | #301 | Tragic $85,792 |
Demographics Similar to Okinawans by Median Family Income
In terms of median family income, the demographic groups most similar to Okinawans are Immigrants from Iran ($130,894, a difference of 0.70%), Immigrants from Hong Kong ($131,067, a difference of 0.84%), Thai ($131,281, a difference of 1.0%), Immigrants from Ireland ($127,584, a difference of 1.9%), and Immigrants from Israel ($127,430, a difference of 2.0%).
| Demographics | Rating | Rank | Median Family Income |
| Immigrants | Taiwan | 100.0 /100 | #2 | Exceptional $136,949 |
| Immigrants | Singapore | 100.0 /100 | #3 | Exceptional $134,818 |
| Immigrants | India | 100.0 /100 | #4 | Exceptional $134,028 |
| Iranians | 100.0 /100 | #5 | Exceptional $133,839 |
| Thais | 100.0 /100 | #6 | Exceptional $131,281 |
| Immigrants | Hong Kong | 100.0 /100 | #7 | Exceptional $131,067 |
| Immigrants | Iran | 100.0 /100 | #8 | Exceptional $130,894 |
| Okinawans | 100.0 /100 | #9 | Exceptional $129,979 |
| Immigrants | Ireland | 100.0 /100 | #10 | Exceptional $127,584 |
| Immigrants | Israel | 100.0 /100 | #11 | Exceptional $127,430 |
| Cypriots | 100.0 /100 | #12 | Exceptional $127,064 |
| Immigrants | Australia | 100.0 /100 | #13 | Exceptional $126,620 |
| Immigrants | South Central Asia | 100.0 /100 | #14 | Exceptional $125,956 |
| Eastern Europeans | 100.0 /100 | #15 | Exceptional $125,546 |
| Immigrants | China | 100.0 /100 | #16 | Exceptional $125,540 |