Fijian vs Crow Median Earnings
COMPARE
Fijian
Crow
Median Earnings
Median Earnings Comparison
Fijians
Crow
$40,193
MEDIAN EARNINGS
0.0/ 100
METRIC RATING
317th/ 347
METRIC RANK
$38,707
MEDIAN EARNINGS
0.0/ 100
METRIC RATING
336th/ 347
METRIC RANK
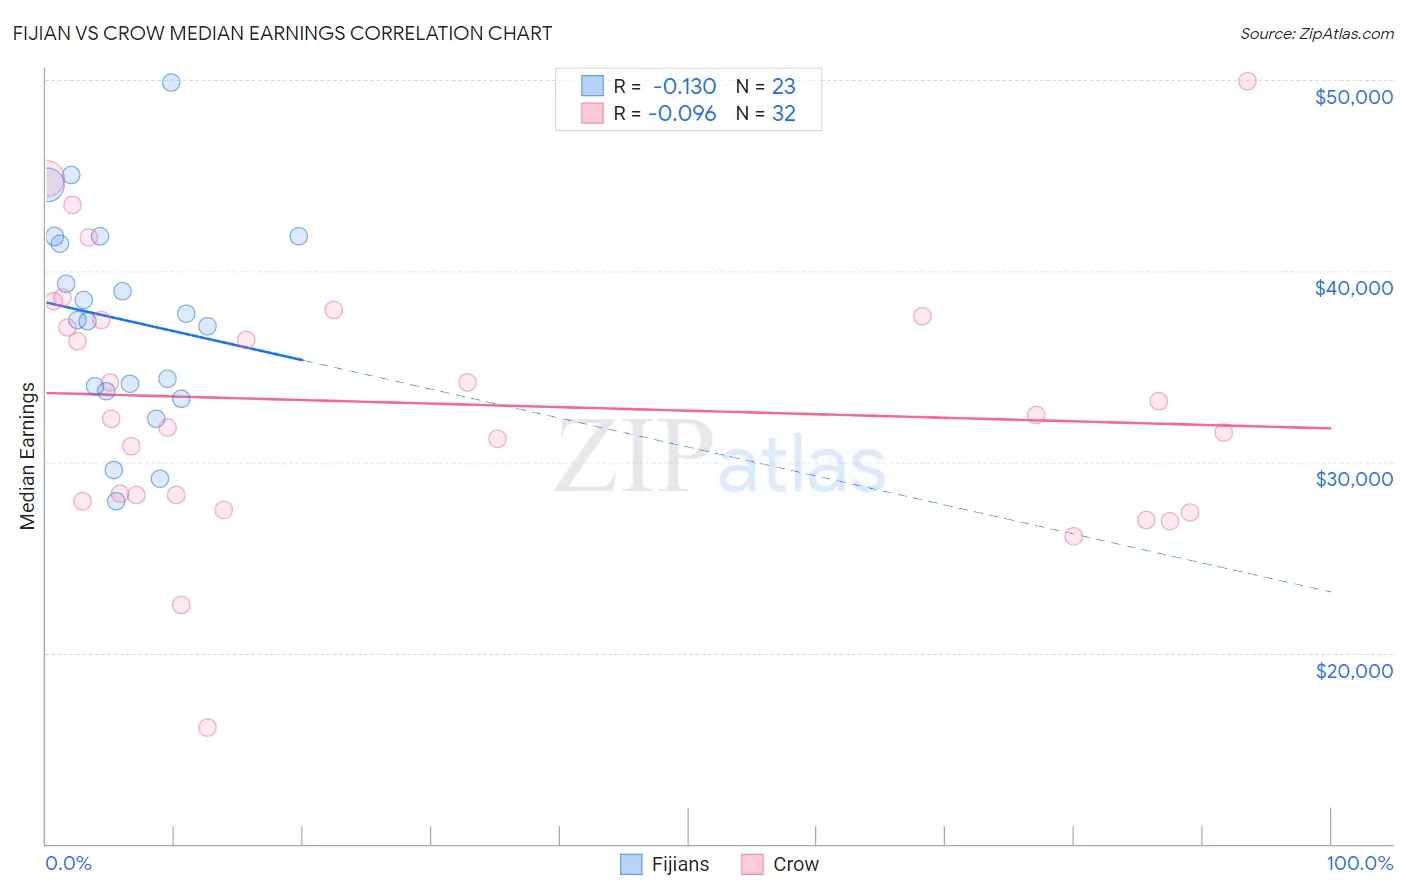
Fijian vs Crow Median Earnings Correlation Chart
The statistical analysis conducted on geographies consisting of 55,947,867 people shows a poor negative correlation between the proportion of Fijians and median earnings in the United States with a correlation coefficient (R) of -0.130 and weighted average of $40,193. Similarly, the statistical analysis conducted on geographies consisting of 59,204,148 people shows a slight negative correlation between the proportion of Crow and median earnings in the United States with a correlation coefficient (R) of -0.096 and weighted average of $38,707, a difference of 3.8%.
Median Earnings Correlation Summary
| Measurement | Fijian | Crow |
| Minimum | $27,917 | $16,094 |
| Maximum | $49,875 | $49,926 |
| Range | $21,958 | $33,832 |
| Mean | $37,430 | $33,045 |
| Median | $37,445 | $32,361 |
| Interquartile 25% (IQ1) | $33,695 | $28,093 |
| Interquartile 75% (IQ3) | $41,805 | $37,549 |
| Interquartile Range (IQR) | $8,109 | $9,456 |
| Standard Deviation (Sample) | $5,451 | $6,875 |
| Standard Deviation (Population) | $5,331 | $6,767 |
Demographics Similar to Fijians and Crow by Median Earnings
In terms of median earnings, the demographic groups most similar to Fijians are Immigrants from Honduras ($40,195, a difference of 0.0%), Dutch West Indian ($40,107, a difference of 0.21%), Black/African American ($40,085, a difference of 0.27%), Immigrants from Bahamas ($39,861, a difference of 0.83%), and Mexican ($39,834, a difference of 0.90%). Similarly, the demographic groups most similar to Crow are Native/Alaskan ($38,896, a difference of 0.49%), Spanish American Indian ($38,907, a difference of 0.52%), Houma ($38,949, a difference of 0.62%), Yakama ($39,107, a difference of 1.0%), and Immigrants from Mexico ($39,114, a difference of 1.1%).
| Demographics | Rating | Rank | Median Earnings |
| Immigrants | Honduras | 0.0 /100 | #316 | Tragic $40,195 |
| Fijians | 0.0 /100 | #317 | Tragic $40,193 |
| Dutch West Indians | 0.0 /100 | #318 | Tragic $40,107 |
| Blacks/African Americans | 0.0 /100 | #319 | Tragic $40,085 |
| Immigrants | Bahamas | 0.0 /100 | #320 | Tragic $39,861 |
| Mexicans | 0.0 /100 | #321 | Tragic $39,834 |
| Immigrants | Central America | 0.0 /100 | #322 | Tragic $39,762 |
| Bahamians | 0.0 /100 | #323 | Tragic $39,735 |
| Ottawa | 0.0 /100 | #324 | Tragic $39,721 |
| Creek | 0.0 /100 | #325 | Tragic $39,648 |
| Immigrants | Yemen | 0.0 /100 | #326 | Tragic $39,540 |
| Yuman | 0.0 /100 | #327 | Tragic $39,523 |
| Sioux | 0.0 /100 | #328 | Tragic $39,448 |
| Kiowa | 0.0 /100 | #329 | Tragic $39,232 |
| Immigrants | Congo | 0.0 /100 | #330 | Tragic $39,169 |
| Immigrants | Mexico | 0.0 /100 | #331 | Tragic $39,114 |
| Yakama | 0.0 /100 | #332 | Tragic $39,107 |
| Houma | 0.0 /100 | #333 | Tragic $38,949 |
| Spanish American Indians | 0.0 /100 | #334 | Tragic $38,907 |
| Natives/Alaskans | 0.0 /100 | #335 | Tragic $38,896 |
| Crow | 0.0 /100 | #336 | Tragic $38,707 |