European vs Norwegian Median Male Earnings
COMPARE
European
Norwegian
Median Male Earnings
Median Male Earnings Comparison
Europeans
Norwegians
$57,637
MEDIAN MALE EARNINGS
95.6/ 100
METRIC RATING
111th/ 347
METRIC RANK
$55,965
MEDIAN MALE EARNINGS
80.9/ 100
METRIC RATING
145th/ 347
METRIC RANK
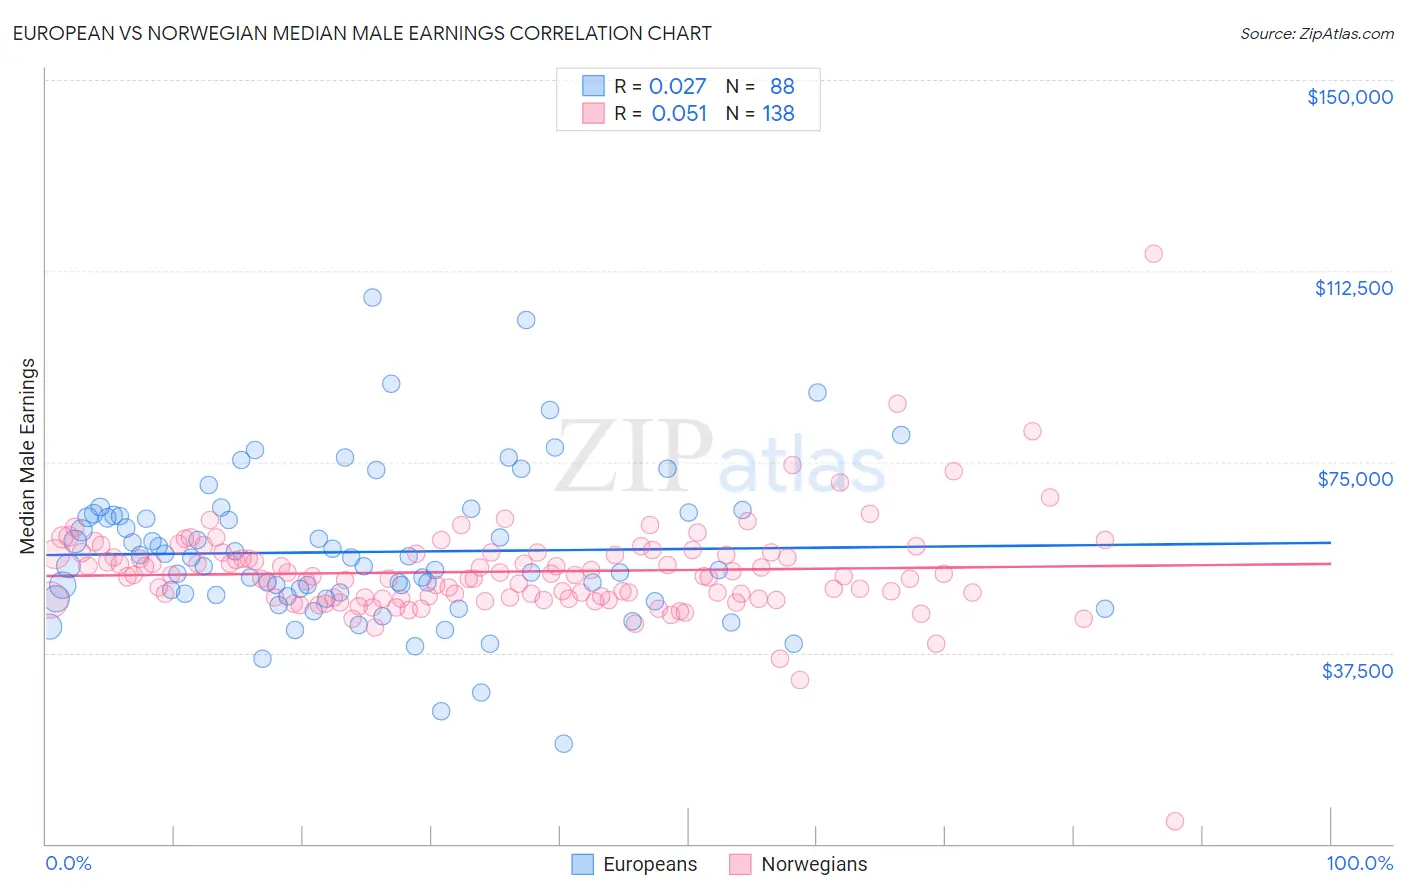
European vs Norwegian Median Male Earnings Correlation Chart
The statistical analysis conducted on geographies consisting of 560,846,229 people shows no correlation between the proportion of Europeans and median male earnings in the United States with a correlation coefficient (R) of 0.027 and weighted average of $57,637. Similarly, the statistical analysis conducted on geographies consisting of 532,659,369 people shows a slight positive correlation between the proportion of Norwegians and median male earnings in the United States with a correlation coefficient (R) of 0.051 and weighted average of $55,965, a difference of 3.0%.
Median Male Earnings Correlation Summary
| Measurement | European | Norwegian |
| Minimum | $19,583 | $4,318 |
| Maximum | $107,377 | $115,833 |
| Range | $87,794 | $111,515 |
| Mean | $57,294 | $53,449 |
| Median | $54,588 | $52,554 |
| Interquartile 25% (IQ1) | $48,703 | $48,297 |
| Interquartile 75% (IQ3) | $64,440 | $57,158 |
| Interquartile Range (IQR) | $15,737 | $8,861 |
| Standard Deviation (Sample) | $14,840 | $10,042 |
| Standard Deviation (Population) | $14,755 | $10,005 |
Similar Demographics by Median Male Earnings
Demographics Similar to Europeans by Median Male Earnings
In terms of median male earnings, the demographic groups most similar to Europeans are Immigrants from Afghanistan ($57,582, a difference of 0.090%), Carpatho Rusyn ($57,572, a difference of 0.11%), Immigrants from Kuwait ($57,562, a difference of 0.13%), Palestinian ($57,778, a difference of 0.25%), and Swedish ($57,445, a difference of 0.33%).
| Demographics | Rating | Rank | Median Male Earnings |
| Armenians | 97.3 /100 | #104 | Exceptional $58,134 |
| Immigrants | Western Asia | 97.3 /100 | #105 | Exceptional $58,131 |
| Immigrants | Northern Africa | 96.9 /100 | #106 | Exceptional $58,008 |
| Serbians | 96.8 /100 | #107 | Exceptional $57,975 |
| Immigrants | Uzbekistan | 96.7 /100 | #108 | Exceptional $57,941 |
| British | 96.5 /100 | #109 | Exceptional $57,890 |
| Palestinians | 96.2 /100 | #110 | Exceptional $57,778 |
| Europeans | 95.6 /100 | #111 | Exceptional $57,637 |
| Immigrants | Afghanistan | 95.4 /100 | #112 | Exceptional $57,582 |
| Carpatho Rusyns | 95.3 /100 | #113 | Exceptional $57,572 |
| Immigrants | Kuwait | 95.3 /100 | #114 | Exceptional $57,562 |
| Swedes | 94.8 /100 | #115 | Exceptional $57,445 |
| Lebanese | 94.6 /100 | #116 | Exceptional $57,409 |
| Immigrants | Zimbabwe | 94.3 /100 | #117 | Exceptional $57,352 |
| Hungarians | 94.0 /100 | #118 | Exceptional $57,309 |
Demographics Similar to Norwegians by Median Male Earnings
In terms of median male earnings, the demographic groups most similar to Norwegians are Immigrants from Chile ($55,954, a difference of 0.020%), Immigrants from Uganda ($56,064, a difference of 0.18%), Immigrants from Philippines ($55,809, a difference of 0.28%), Sri Lankan ($56,136, a difference of 0.31%), and Scottish ($55,793, a difference of 0.31%).
| Demographics | Rating | Rank | Median Male Earnings |
| Slovaks | 85.5 /100 | #138 | Excellent $56,306 |
| Zimbabweans | 85.5 /100 | #139 | Excellent $56,302 |
| Luxembourgers | 85.5 /100 | #140 | Excellent $56,300 |
| Danes | 84.8 /100 | #141 | Excellent $56,246 |
| Ethiopians | 84.8 /100 | #142 | Excellent $56,243 |
| Sri Lankans | 83.4 /100 | #143 | Excellent $56,136 |
| Immigrants | Uganda | 82.4 /100 | #144 | Excellent $56,064 |
| Norwegians | 80.9 /100 | #145 | Excellent $55,965 |
| Immigrants | Chile | 80.7 /100 | #146 | Excellent $55,954 |
| Immigrants | Philippines | 78.4 /100 | #147 | Good $55,809 |
| Scottish | 78.2 /100 | #148 | Good $55,793 |
| English | 77.4 /100 | #149 | Good $55,747 |
| Swiss | 77.1 /100 | #150 | Good $55,731 |
| Immigrants | Oceania | 76.8 /100 | #151 | Good $55,712 |
| Peruvians | 75.8 /100 | #152 | Good $55,659 |