Ethiopian vs Potawatomi Householder Income Ages 25 - 44 years
COMPARE
Ethiopian
Potawatomi
Householder Income Ages 25 - 44 years
Householder Income Ages 25 - 44 years Comparison
Ethiopians
Potawatomi
$96,824
HOUSEHOLDER INCOME AGES 25 - 44 YEARS
77.8/ 100
METRIC RATING
146th/ 347
METRIC RANK
$81,774
HOUSEHOLDER INCOME AGES 25 - 44 YEARS
0.1/ 100
METRIC RATING
291st/ 347
METRIC RANK
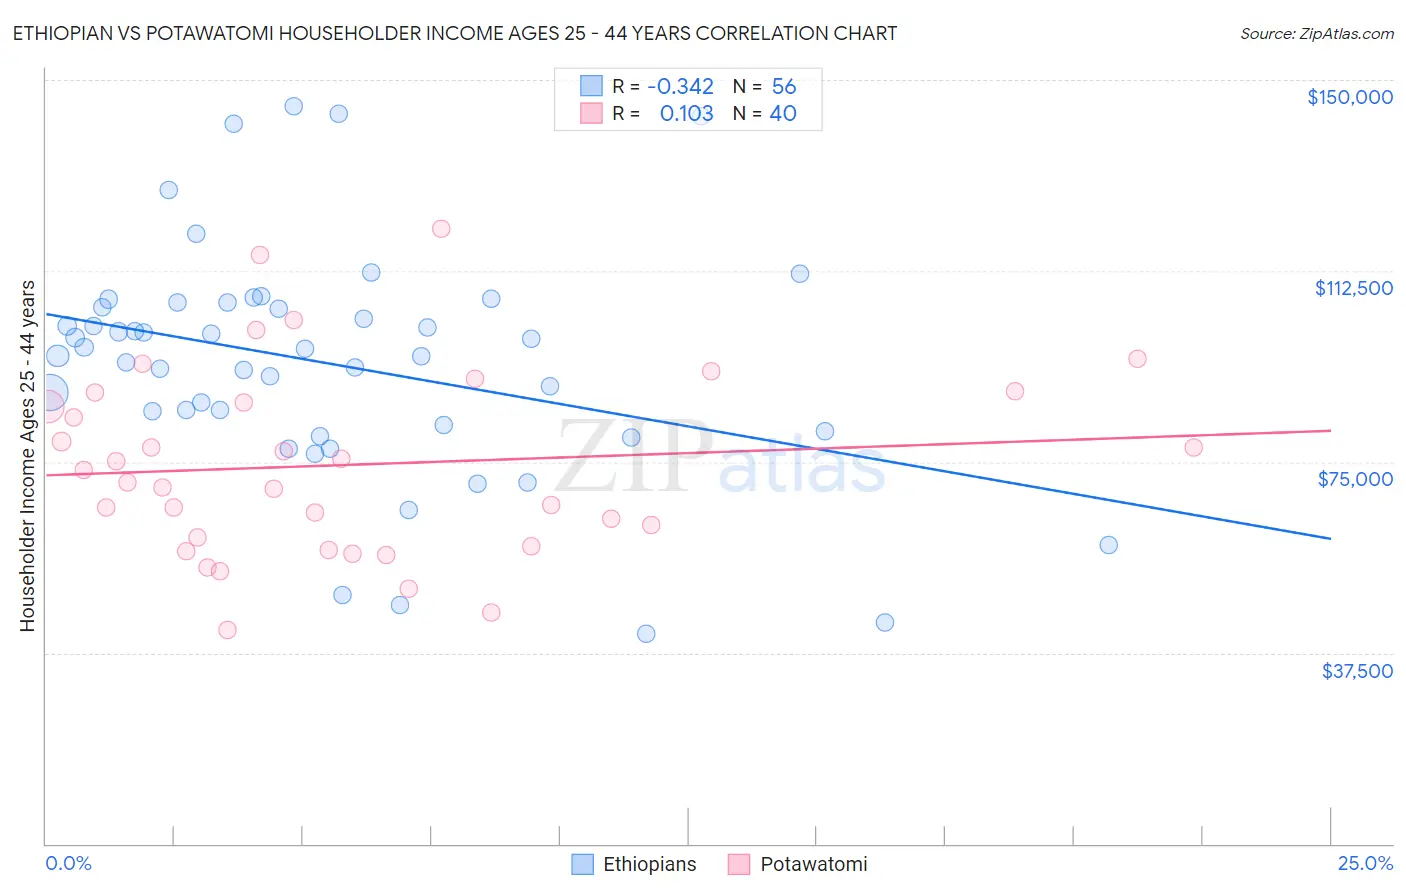
Ethiopian vs Potawatomi Householder Income Ages 25 - 44 years Correlation Chart
The statistical analysis conducted on geographies consisting of 222,918,635 people shows a mild negative correlation between the proportion of Ethiopians and household income with householder between the ages 25 and 44 in the United States with a correlation coefficient (R) of -0.342 and weighted average of $96,824. Similarly, the statistical analysis conducted on geographies consisting of 117,622,599 people shows a poor positive correlation between the proportion of Potawatomi and household income with householder between the ages 25 and 44 in the United States with a correlation coefficient (R) of 0.103 and weighted average of $81,774, a difference of 18.4%.
Householder Income Ages 25 - 44 years Correlation Summary
| Measurement | Ethiopian | Potawatomi |
| Minimum | $41,159 | $41,983 |
| Maximum | $144,957 | $120,714 |
| Range | $103,798 | $78,731 |
| Mean | $94,277 | $74,403 |
| Median | $96,491 | $72,124 |
| Interquartile 25% (IQ1) | $81,678 | $59,264 |
| Interquartile 75% (IQ3) | $105,834 | $87,578 |
| Interquartile Range (IQR) | $24,156 | $28,314 |
| Standard Deviation (Sample) | $22,788 | $18,398 |
| Standard Deviation (Population) | $22,583 | $18,166 |
Similar Demographics by Householder Income Ages 25 - 44 years
Demographics Similar to Ethiopians by Householder Income Ages 25 - 44 years
In terms of householder income ages 25 - 44 years, the demographic groups most similar to Ethiopians are Norwegian ($96,866, a difference of 0.040%), Immigrants from Syria ($96,789, a difference of 0.040%), Irish ($96,730, a difference of 0.10%), Basque ($96,709, a difference of 0.12%), and Ugandan ($96,667, a difference of 0.16%).
| Demographics | Rating | Rank | Householder Income Ages 25 - 44 years |
| Immigrants | Peru | 82.2 /100 | #139 | Excellent $97,329 |
| Immigrants | Morocco | 82.0 /100 | #140 | Excellent $97,305 |
| Luxembourgers | 81.5 /100 | #141 | Excellent $97,237 |
| Danes | 81.3 /100 | #142 | Excellent $97,221 |
| Immigrants | Jordan | 81.0 /100 | #143 | Excellent $97,185 |
| Immigrants | Chile | 80.8 /100 | #144 | Excellent $97,159 |
| Norwegians | 78.2 /100 | #145 | Good $96,866 |
| Ethiopians | 77.8 /100 | #146 | Good $96,824 |
| Immigrants | Syria | 77.4 /100 | #147 | Good $96,789 |
| Irish | 76.9 /100 | #148 | Good $96,730 |
| Basques | 76.6 /100 | #149 | Good $96,709 |
| Ugandans | 76.2 /100 | #150 | Good $96,667 |
| Czechs | 74.8 /100 | #151 | Good $96,525 |
| South American Indians | 74.5 /100 | #152 | Good $96,497 |
| Slovenes | 73.9 /100 | #153 | Good $96,439 |
Demographics Similar to Potawatomi by Householder Income Ages 25 - 44 years
In terms of householder income ages 25 - 44 years, the demographic groups most similar to Potawatomi are Yaqui ($81,656, a difference of 0.14%), Liberian ($82,005, a difference of 0.28%), Blackfeet ($81,531, a difference of 0.30%), Shoshone ($82,062, a difference of 0.35%), and Cuban ($81,483, a difference of 0.36%).
| Demographics | Rating | Rank | Householder Income Ages 25 - 44 years |
| Immigrants | Middle Africa | 0.1 /100 | #284 | Tragic $82,254 |
| Immigrants | Somalia | 0.1 /100 | #285 | Tragic $82,188 |
| Ute | 0.1 /100 | #286 | Tragic $82,166 |
| Immigrants | Latin America | 0.1 /100 | #287 | Tragic $82,166 |
| Comanche | 0.1 /100 | #288 | Tragic $82,152 |
| Shoshone | 0.1 /100 | #289 | Tragic $82,062 |
| Liberians | 0.1 /100 | #290 | Tragic $82,005 |
| Potawatomi | 0.1 /100 | #291 | Tragic $81,774 |
| Yaqui | 0.1 /100 | #292 | Tragic $81,656 |
| Blackfeet | 0.1 /100 | #293 | Tragic $81,531 |
| Cubans | 0.1 /100 | #294 | Tragic $81,483 |
| Bangladeshis | 0.1 /100 | #295 | Tragic $81,363 |
| Immigrants | Dominica | 0.1 /100 | #296 | Tragic $81,351 |
| Immigrants | Guatemala | 0.1 /100 | #297 | Tragic $81,341 |
| Dominicans | 0.1 /100 | #298 | Tragic $81,229 |