Ethiopian vs Immigrants from Micronesia Householder Income Over 65 years

COMPARE

Ethiopian
Race
Ancestry
AfghanAfricanAlaska NativeAlaskan AthabascanAlbanianAleutAlsatianAmericanApacheArabArapahoArgentineanArmenianAssyrian/Chaldean/SyriacAustralianAustrianBahamianBangladeshiBarbadianBasqueBelgianBelizeanBermudanBhutaneseBlackfeetBolivianBrazilianBritishBritish West IndianBulgarianBurmeseCajunCambodianCanadianCape VerdeanCarpatho RusynCelticCentral AmericanCentral American IndianCherokeeCheyenneChickasawChileanChineseChippewaChoctawColombianColvilleComancheCosta RicanCreeCreekCroatianCrowCubanCypriotCzechCzechoslovakianDanishDelawareDominicanDutchDutch West IndianEastern EuropeanEcuadorianEgyptianEnglishEstonianEthiopianEuropeanFijianFilipinoFinnishFrenchFrench American IndianFrench CanadianGermanGerman RussianGhanaianGreekGuamanian/ChamorroGuatemalanGuyaneseHaitianHmongHonduranHopiHoumaHungarianIcelanderIndian (Asian)IndonesianInupiatIranianIraqiIrishIroquoisIsraeliItalianJamaicanJapaneseJordanianKenyanKiowaKoreanLaotianLatvianLebaneseLiberianLithuanianLumbeeLuxembourgerMacedonianMalaysianMalteseMarshalleseMenomineeMexicanMexican American IndianMongolianMoroccanNative HawaiianNavajoNepaleseNew ZealanderNicaraguanNigerianNorthern EuropeanNorwegianOkinawanOsageOttawaPaiutePakistaniPalestinianPanamanianParaguayanPennsylvania GermanPeruvianPimaPolishPortuguesePotawatomiPuebloPuerto RicanPuget Sound SalishRomanianRussianSalvadoranSamoanScandinavianScotch-IrishScottishSeminoleSenegaleseSerbianShoshoneSierra LeoneanSiouxSlavicSlovakSloveneSomaliSouth AfricanSouth AmericanSouth American IndianSoviet UnionSpaniardSpanishSpanish AmericanSpanish American IndianSri LankanSubsaharan AfricanSudaneseSwedishSwissSyrianTaiwaneseThaiTlingit-HaidaTohono O'OdhamTonganTrinidadian and TobagonianTsimshianTurkishU.S. Virgin IslanderUgandanUkrainianUruguayanUteVenezuelanVietnameseWelshWest IndianYakamaYaquiYugoslavianYumanYup'ikZimbabwean
Immigration
NonimmigrantsImmigrantsAfghanistanAfricaAlbaniaArgentinaArmeniaAsiaAustraliaAustriaBahamasBangladeshBarbadosBelarusBelgiumBelizeBoliviaBosnia and HerzegovinaBrazilBulgariaBurma/MyanmarCabo VerdeCambodiaCameroonCanadaCaribbeanCentral AmericaChileChinaColombiaCongoCosta RicaCroatiaCubaCzechoslovakiaDenmarkDominicaDominican RepublicEastern AfricaEastern AsiaEastern EuropeEcuadorEgyptEl SalvadorEnglandEritreaEthiopiaEuropeFijiFranceGermanyGhanaGreeceGrenadaGuatemalaGuyanaHaitiHondurasHong KongHungaryIndiaIndonesiaIranIraqIrelandIsraelItalyJamaicaJapanJordanKazakhstanKenyaKoreaKuwaitLaosLatin AmericaLatviaLebanonLiberiaLithuaniaMalaysiaMexicoMiddle AfricaMoldovaMoroccoNepalNetherlandsNicaraguaNigeriaNorth AmericaNorth MacedoniaNorthern AfricaNorthern EuropeNorwayOceaniaPakistanPanamaPeruPhilippinesPolandPortugalRomaniaRussiaSaudi ArabiaScotlandSenegalSerbiaSierra LeoneSingaporeSomaliaSouth AfricaSouth AmericaSouth Central AsiaSouth Eastern AsiaSouthern EuropeSpainSri LankaSt. Vincent and the GrenadinesSudanSwedenSwitzerlandSyriaTaiwanThailandTrinidad and TobagoTurkeyUgandaUkraineUruguayUzbekistanVenezuelaVietnamWest IndiesWestern AfricaWestern AsiaWestern EuropeYemenZaireZimbabweAzores
Immigrants from Micronesia
Race
Ancestry
AfghanAfricanAlaska NativeAlaskan AthabascanAlbanianAleutAlsatianAmericanApacheArabArapahoArgentineanArmenianAssyrian/Chaldean/SyriacAustralianAustrianBahamianBangladeshiBarbadianBasqueBelgianBelizeanBermudanBhutaneseBlackfeetBolivianBrazilianBritishBritish West IndianBulgarianBurmeseCajunCambodianCanadianCape VerdeanCarpatho RusynCelticCentral AmericanCentral American IndianCherokeeCheyenneChickasawChileanChineseChippewaChoctawColombianColvilleComancheCosta RicanCreeCreekCroatianCrowCubanCypriotCzechCzechoslovakianDanishDelawareDominicanDutchDutch West IndianEastern EuropeanEcuadorianEgyptianEnglishEstonianEuropeanFijianFilipinoFinnishFrenchFrench American IndianFrench CanadianGermanGerman RussianGhanaianGreekGuamanian/ChamorroGuatemalanGuyaneseHaitianHmongHonduranHopiHoumaHungarianIcelanderIndian (Asian)IndonesianInupiatIranianIraqiIrishIroquoisIsraeliItalianJamaicanJapaneseJordanianKenyanKiowaKoreanLaotianLatvianLebaneseLiberianLithuanianLumbeeLuxembourgerMacedonianMalaysianMalteseMarshalleseMenomineeMexicanMexican American IndianMongolianMoroccanNative HawaiianNavajoNepaleseNew ZealanderNicaraguanNigerianNorthern EuropeanNorwegianOkinawanOsageOttawaPaiutePakistaniPalestinianPanamanianParaguayanPennsylvania GermanPeruvianPimaPolishPortuguesePotawatomiPuebloPuerto RicanPuget Sound SalishRomanianRussianSalvadoranSamoanScandinavianScotch-IrishScottishSeminoleSenegaleseSerbianShoshoneSierra LeoneanSiouxSlavicSlovakSloveneSomaliSouth AfricanSouth AmericanSouth American IndianSoviet UnionSpaniardSpanishSpanish AmericanSpanish American IndianSri LankanSubsaharan AfricanSudaneseSwedishSwissSyrianTaiwaneseThaiTlingit-HaidaTohono O'OdhamTonganTrinidadian and TobagonianTsimshianTurkishU.S. Virgin IslanderUgandanUkrainianUruguayanUteVenezuelanVietnameseWelshWest IndianYakamaYaquiYugoslavianYumanYup'ikZimbabwean
Immigration
NonimmigrantsImmigrantsAfghanistanAfricaAlbaniaArgentinaArmeniaAsiaAustraliaAustriaBahamasBangladeshBarbadosBelarusBelgiumBelizeBoliviaBosnia and HerzegovinaBrazilBulgariaBurma/MyanmarCabo VerdeCambodiaCameroonCanadaCaribbeanCentral AmericaChileChinaColombiaCongoCosta RicaCroatiaCubaCzechoslovakiaDenmarkDominicaDominican RepublicEastern AfricaEastern AsiaEastern EuropeEcuadorEgyptEl SalvadorEnglandEritreaEthiopiaEuropeFijiFranceGermanyGhanaGreeceGrenadaGuatemalaGuyanaHaitiHondurasHong KongHungaryIndiaIndonesiaIranIraqIrelandIsraelItalyJamaicaJapanJordanKazakhstanKenyaKoreaKuwaitLaosLatin AmericaLatviaLebanonLiberiaLithuaniaMalaysiaMexicoMicronesiaMiddle AfricaMoldovaMoroccoNepalNetherlandsNicaraguaNigeriaNorth AmericaNorth MacedoniaNorthern AfricaNorthern EuropeNorwayOceaniaPakistanPanamaPeruPhilippinesPolandPortugalRomaniaRussiaSaudi ArabiaScotlandSenegalSerbiaSierra LeoneSingaporeSomaliaSouth AfricaSouth AmericaSouth Central AsiaSouth Eastern AsiaSouthern EuropeSpainSri LankaSt. Vincent and the GrenadinesSudanSwedenSwitzerlandSyriaTaiwanThailandTrinidad and TobagoTurkeyUgandaUkraineUruguayUzbekistanVenezuelaVietnamWest IndiesWestern AfricaWestern AsiaWestern EuropeYemenZaireZimbabweAzores
Householder Income Over 65 years
Income
Poverty
Unemployment
Labor Participation
Family Structure
Vehicle Availability
Education Level
Disability

Householder Income Over 65 years Comparison

Ethiopians

Immigrants from Micronesia

Exceptional
Average
$64,989
HOUSEHOLDER INCOME OVER 65 YEARS
98.5/ 100
METRIC RATING
76th/ 347
METRIC RANK
$61,000
HOUSEHOLDER INCOME OVER 65 YEARS
50.8/ 100
METRIC RATING
173rd/ 347
METRIC RANK

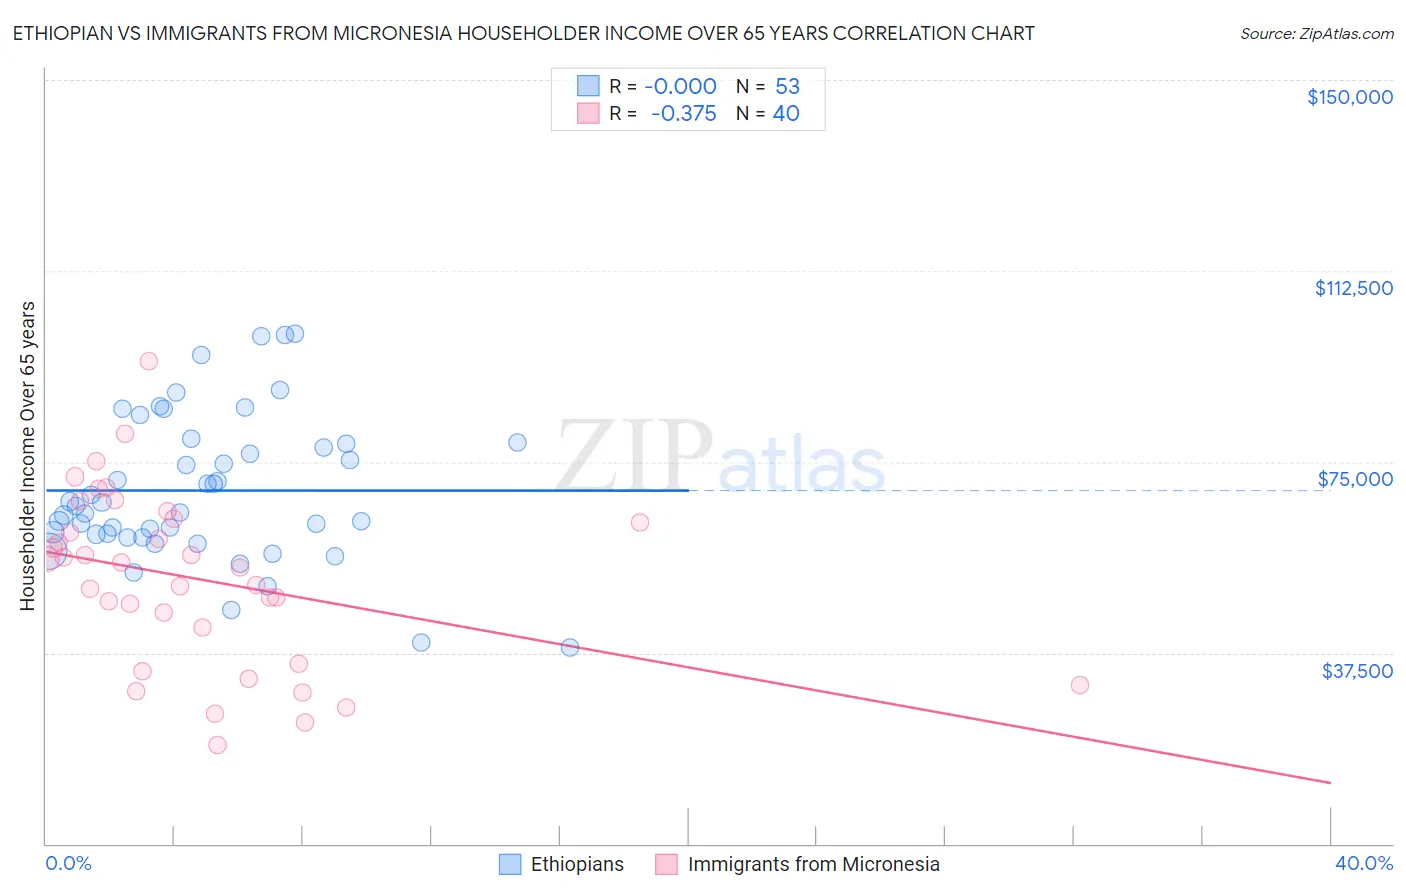
Ethiopian vs Immigrants from Micronesia Householder Income Over 65 years Correlation Chart

The statistical analysis conducted on geographies consisting of 222,712,821 people shows no correlation between the proportion of Ethiopians and household income with householder over the age of 65 in the United States with a correlation coefficient (R) of -0.000 and weighted average of $64,989. Similarly, the statistical analysis conducted on geographies consisting of 61,368,968 people shows a mild negative correlation between the proportion of Immigrants from Micronesia and household income with householder over the age of 65 in the United States with a correlation coefficient (R) of -0.375 and weighted average of $61,000, a difference of 6.5%.
Ethiopian vs Immigrants from Micronesia Householder Income Over 65 years

Householder Income Over 65 years Correlation Summary

MeasurementEthiopianImmigrants from Micronesia
Minimum$38,469$19,375
Maximum$100,125$94,868
Range$61,656$75,493
Mean$69,385$52,032
Median$66,361$54,757
Interquartile 25% (IQ1)$60,479$38,889
Interquartile 75% (IQ3)$78,686$63,458
Interquartile Range (IQR)$18,206$24,569
Standard Deviation (Sample)$14,365$17,019
Standard Deviation (Population)$14,229$16,805

Similar Demographics by Householder Income Over 65 years

Demographics Similar to Ethiopians by Householder Income Over 65 years

In terms of householder income over 65 years, the demographic groups most similar to Ethiopians are Immigrants from Canada ($64,952, a difference of 0.060%), Sierra Leonean ($65,038, a difference of 0.080%), Immigrants from Western Europe ($64,933, a difference of 0.090%), Hawaiian ($64,920, a difference of 0.11%), and Immigrants from North America ($64,856, a difference of 0.21%).
DemographicsRating | RankHouseholder Income Over 65 years
Samoans
99.1
/100
|
#69
Exceptional
$65,427
Mongolians
99.0
/100
|
#70
Exceptional
$65,326
Greeks
98.9
/100
|
#71
Exceptional
$65,306
Argentineans
98.9
/100
|
#72
Exceptional
$65,246
Immigrants | Ethiopia
98.9
/100
|
#73
Exceptional
$65,238
Lithuanians
98.8
/100
|
#74
Exceptional
$65,209
Sierra Leoneans
98.6
/100
|
#75
Exceptional
$65,038
Ethiopians
98.5
/100
|
#76
Exceptional
$64,989
Immigrants | Canada
98.5
/100
|
#77
Exceptional
$64,952
Immigrants | Western Europe
98.5
/100
|
#78
Exceptional
$64,933
Hawaiians
98.4
/100
|
#79
Exceptional
$64,920
Immigrants | North America
98.3
/100
|
#80
Exceptional
$64,856
Immigrants | Europe
98.3
/100
|
#81
Exceptional
$64,828
Immigrants | Fiji
98.2
/100
|
#82
Exceptional
$64,795
Northern Europeans
97.9
/100
|
#83
Exceptional
$64,658

Demographics Similar to Immigrants from Micronesia by Householder Income Over 65 years

In terms of householder income over 65 years, the demographic groups most similar to Immigrants from Micronesia are Luxembourger ($60,967, a difference of 0.050%), Immigrants from Poland ($61,041, a difference of 0.070%), Inupiat ($61,061, a difference of 0.10%), Serbian ($61,087, a difference of 0.14%), and Carpatho Rusyn ($61,093, a difference of 0.15%).
DemographicsRating | RankHouseholder Income Over 65 years
Immigrants | Eastern Africa
55.0
/100
|
#166
Average
$61,157
Norwegians
53.6
/100
|
#167
Average
$61,104
Irish
53.4
/100
|
#168
Average
$61,097
Carpatho Rusyns
53.3
/100
|
#169
Average
$61,093
Serbians
53.1
/100
|
#170
Average
$61,087
Inupiat
52.4
/100
|
#171
Average
$61,061
Immigrants | Poland
51.9
/100
|
#172
Average
$61,041
Immigrants | Micronesia
50.8
/100
|
#173
Average
$61,000
Luxembourgers
50.0
/100
|
#174
Average
$60,967
Spaniards
47.3
/100
|
#175
Average
$60,866
Spanish
45.5
/100
|
#176
Average
$60,795
Alaska Natives
44.3
/100
|
#177
Average
$60,748
Yup'ik
43.7
/100
|
#178
Average
$60,727
Welsh
42.2
/100
|
#179
Average
$60,666
Immigrants | Morocco
41.7
/100
|
#180
Average
$60,647