English vs Immigrants from Uzbekistan Median Household Income
COMPARE
English
Immigrants from Uzbekistan
Median Household Income
Median Household Income Comparison
English
Immigrants from Uzbekistan
$84,915
MEDIAN HOUSEHOLD INCOME
47.0/ 100
METRIC RATING
179th/ 347
METRIC RANK
$86,425
MEDIAN HOUSEHOLD INCOME
70.1/ 100
METRIC RATING
159th/ 347
METRIC RANK
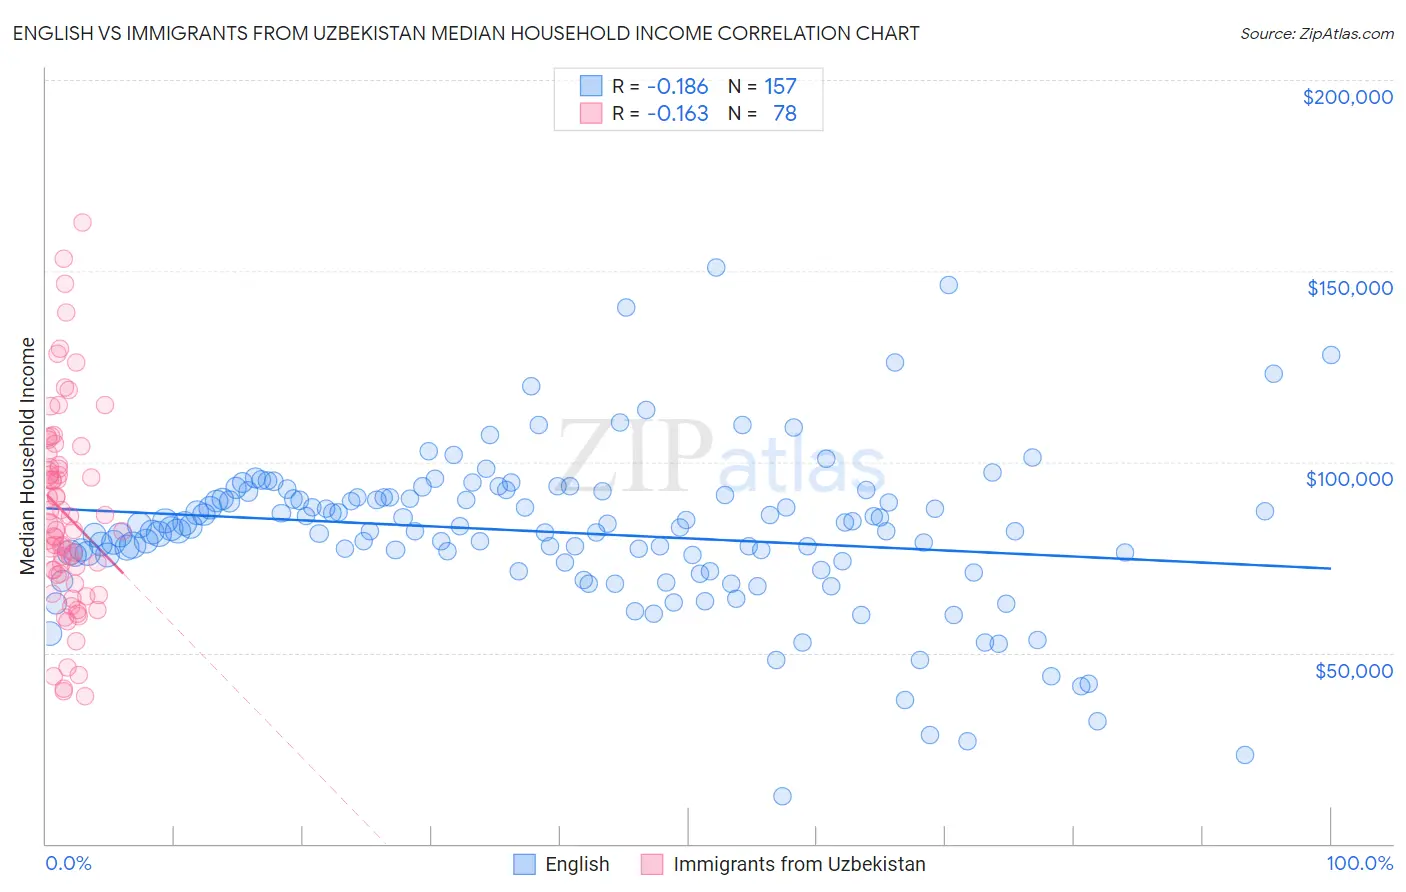
English vs Immigrants from Uzbekistan Median Household Income Correlation Chart
The statistical analysis conducted on geographies consisting of 578,383,901 people shows a poor negative correlation between the proportion of English and median household income in the United States with a correlation coefficient (R) of -0.186 and weighted average of $84,915. Similarly, the statistical analysis conducted on geographies consisting of 118,697,926 people shows a poor negative correlation between the proportion of Immigrants from Uzbekistan and median household income in the United States with a correlation coefficient (R) of -0.163 and weighted average of $86,425, a difference of 1.8%.
Median Household Income Correlation Summary
| Measurement | English | Immigrants from Uzbekistan |
| Minimum | $12,326 | $38,670 |
| Maximum | $150,805 | $162,808 |
| Range | $138,479 | $124,138 |
| Mean | $81,510 | $86,352 |
| Median | $82,609 | $82,168 |
| Interquartile 25% (IQ1) | $73,869 | $70,322 |
| Interquartile 75% (IQ3) | $90,807 | $99,228 |
| Interquartile Range (IQR) | $16,938 | $28,906 |
| Standard Deviation (Sample) | $20,635 | $26,082 |
| Standard Deviation (Population) | $20,569 | $25,914 |
Demographics Similar to English and Immigrants from Uzbekistan by Median Household Income
In terms of median household income, the demographic groups most similar to English are Czechoslovakian ($84,965, a difference of 0.060%), Immigrants from Eritrea ($85,025, a difference of 0.13%), Immigrants from Costa Rica ($85,054, a difference of 0.16%), Alsatian ($85,053, a difference of 0.16%), and Scottish ($85,101, a difference of 0.22%). Similarly, the demographic groups most similar to Immigrants from Uzbekistan are Luxembourger ($86,418, a difference of 0.010%), Slavic ($86,398, a difference of 0.030%), Guamanian/Chamorro ($86,255, a difference of 0.20%), Czech ($86,164, a difference of 0.30%), and Irish ($86,145, a difference of 0.33%).
| Demographics | Rating | Rank | Median Household Income |
| Immigrants | Uzbekistan | 70.1 /100 | #159 | Good $86,425 |
| Luxembourgers | 70.0 /100 | #160 | Good $86,418 |
| Slavs | 69.7 /100 | #161 | Good $86,398 |
| Guamanians/Chamorros | 67.7 /100 | #162 | Good $86,255 |
| Czechs | 66.4 /100 | #163 | Good $86,164 |
| Irish | 66.2 /100 | #164 | Good $86,145 |
| Norwegians | 65.3 /100 | #165 | Good $86,084 |
| Scandinavians | 65.1 /100 | #166 | Good $86,073 |
| Immigrants | Immigrants | 61.3 /100 | #167 | Good $85,818 |
| Icelanders | 61.0 /100 | #168 | Good $85,797 |
| Colombians | 59.7 /100 | #169 | Average $85,716 |
| Swiss | 59.2 /100 | #170 | Average $85,681 |
| Immigrants | South America | 58.1 /100 | #171 | Average $85,611 |
| Slovenes | 57.4 /100 | #172 | Average $85,562 |
| Immigrants | Cameroon | 53.4 /100 | #173 | Average $85,314 |
| Scottish | 50.0 /100 | #174 | Average $85,101 |
| Immigrants | Costa Rica | 49.2 /100 | #175 | Average $85,054 |
| Alsatians | 49.2 /100 | #176 | Average $85,053 |
| Immigrants | Eritrea | 48.8 /100 | #177 | Average $85,025 |
| Czechoslovakians | 47.8 /100 | #178 | Average $84,965 |
| English | 47.0 /100 | #179 | Average $84,915 |