English vs Immigrants from Israel Median Female Earnings
COMPARE
English
Immigrants from Israel
Median Female Earnings
Median Female Earnings Comparison
English
Immigrants from Israel
$38,196
MEDIAN FEMALE EARNINGS
4.2/ 100
METRIC RATING
239th/ 347
METRIC RANK
$46,902
MEDIAN FEMALE EARNINGS
100.0/ 100
METRIC RATING
12th/ 347
METRIC RANK
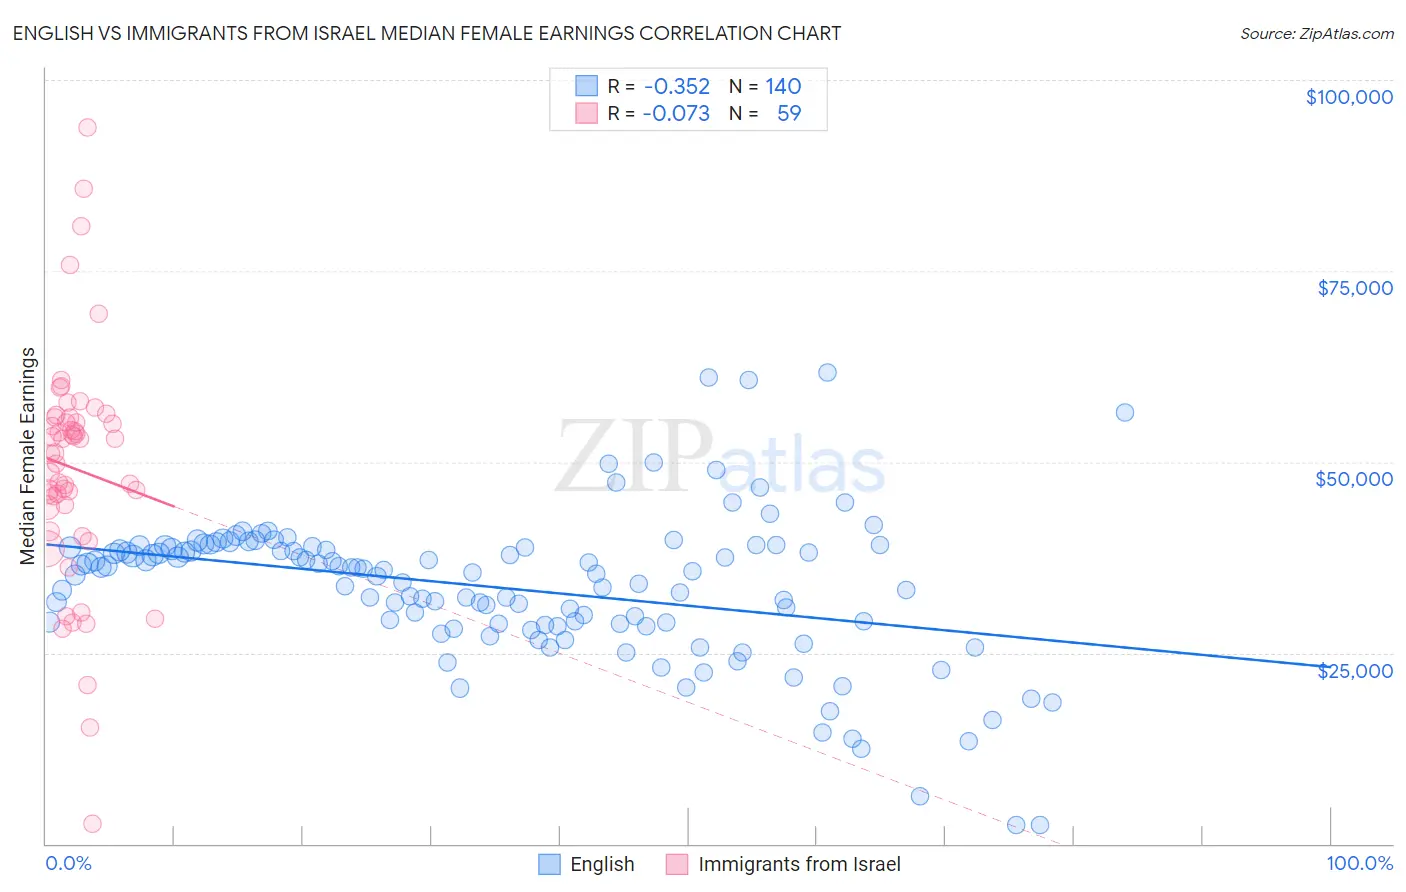
English vs Immigrants from Israel Median Female Earnings Correlation Chart
The statistical analysis conducted on geographies consisting of 577,154,042 people shows a mild negative correlation between the proportion of English and median female earnings in the United States with a correlation coefficient (R) of -0.352 and weighted average of $38,196. Similarly, the statistical analysis conducted on geographies consisting of 209,992,905 people shows a slight negative correlation between the proportion of Immigrants from Israel and median female earnings in the United States with a correlation coefficient (R) of -0.073 and weighted average of $46,902, a difference of 22.8%.
Median Female Earnings Correlation Summary
| Measurement | English | Immigrants from Israel |
| Minimum | $2,499 | $2,606 |
| Maximum | $61,721 | $93,787 |
| Range | $59,222 | $91,181 |
| Mean | $33,482 | $49,152 |
| Median | $35,643 | $51,157 |
| Interquartile 25% (IQ1) | $28,708 | $44,051 |
| Interquartile 75% (IQ3) | $38,774 | $55,815 |
| Interquartile Range (IQR) | $10,066 | $11,764 |
| Standard Deviation (Sample) | $9,710 | $15,373 |
| Standard Deviation (Population) | $9,675 | $15,242 |
Similar Demographics by Median Female Earnings
Demographics Similar to English by Median Female Earnings
In terms of median female earnings, the demographic groups most similar to English are Alaska Native ($38,202, a difference of 0.020%), Immigrants from Cabo Verde ($38,208, a difference of 0.030%), Sudanese ($38,215, a difference of 0.050%), Liberian ($38,215, a difference of 0.050%), and Finnish ($38,173, a difference of 0.060%).
| Demographics | Rating | Rank | Median Female Earnings |
| Scandinavians | 5.2 /100 | #232 | Tragic $38,306 |
| Tongans | 5.1 /100 | #233 | Tragic $38,288 |
| Celtics | 5.0 /100 | #234 | Tragic $38,283 |
| Sudanese | 4.4 /100 | #235 | Tragic $38,215 |
| Liberians | 4.4 /100 | #236 | Tragic $38,215 |
| Immigrants | Cabo Verde | 4.3 /100 | #237 | Tragic $38,208 |
| Alaska Natives | 4.3 /100 | #238 | Tragic $38,202 |
| English | 4.2 /100 | #239 | Tragic $38,196 |
| Finns | 4.0 /100 | #240 | Tragic $38,173 |
| Spanish | 3.5 /100 | #241 | Tragic $38,098 |
| Immigrants | Burma/Myanmar | 3.0 /100 | #242 | Tragic $38,028 |
| Germans | 2.8 /100 | #243 | Tragic $37,986 |
| Immigrants | Liberia | 2.7 /100 | #244 | Tragic $37,970 |
| Immigrants | Middle Africa | 2.7 /100 | #245 | Tragic $37,965 |
| Delaware | 2.6 /100 | #246 | Tragic $37,964 |
Demographics Similar to Immigrants from Israel by Median Female Earnings
In terms of median female earnings, the demographic groups most similar to Immigrants from Israel are Okinawan ($46,905, a difference of 0.010%), Immigrants from China ($46,972, a difference of 0.15%), Immigrants from Iran ($47,154, a difference of 0.54%), Immigrants from Australia ($46,573, a difference of 0.71%), and Soviet Union ($46,556, a difference of 0.74%).
| Demographics | Rating | Rank | Median Female Earnings |
| Immigrants | Singapore | 100.0 /100 | #5 | Exceptional $47,986 |
| Immigrants | Ireland | 100.0 /100 | #6 | Exceptional $47,598 |
| Thais | 100.0 /100 | #7 | Exceptional $47,577 |
| Iranians | 100.0 /100 | #8 | Exceptional $47,421 |
| Immigrants | Iran | 100.0 /100 | #9 | Exceptional $47,154 |
| Immigrants | China | 100.0 /100 | #10 | Exceptional $46,972 |
| Okinawans | 100.0 /100 | #11 | Exceptional $46,905 |
| Immigrants | Israel | 100.0 /100 | #12 | Exceptional $46,902 |
| Immigrants | Australia | 100.0 /100 | #13 | Exceptional $46,573 |
| Soviet Union | 100.0 /100 | #14 | Exceptional $46,556 |
| Immigrants | Eastern Asia | 100.0 /100 | #15 | Exceptional $46,502 |
| Indians (Asian) | 100.0 /100 | #16 | Exceptional $46,481 |
| Immigrants | South Central Asia | 100.0 /100 | #17 | Exceptional $46,324 |
| Cypriots | 100.0 /100 | #18 | Exceptional $45,570 |
| Eastern Europeans | 100.0 /100 | #19 | Exceptional $45,385 |