Egyptian vs Estonian Median Household Income
COMPARE
Egyptian
Estonian
Median Household Income
Median Household Income Comparison
Egyptians
Estonians
$95,673
MEDIAN HOUSEHOLD INCOME
99.9/ 100
METRIC RATING
54th/ 347
METRIC RANK
$95,930
MEDIAN HOUSEHOLD INCOME
99.9/ 100
METRIC RATING
51st/ 347
METRIC RANK
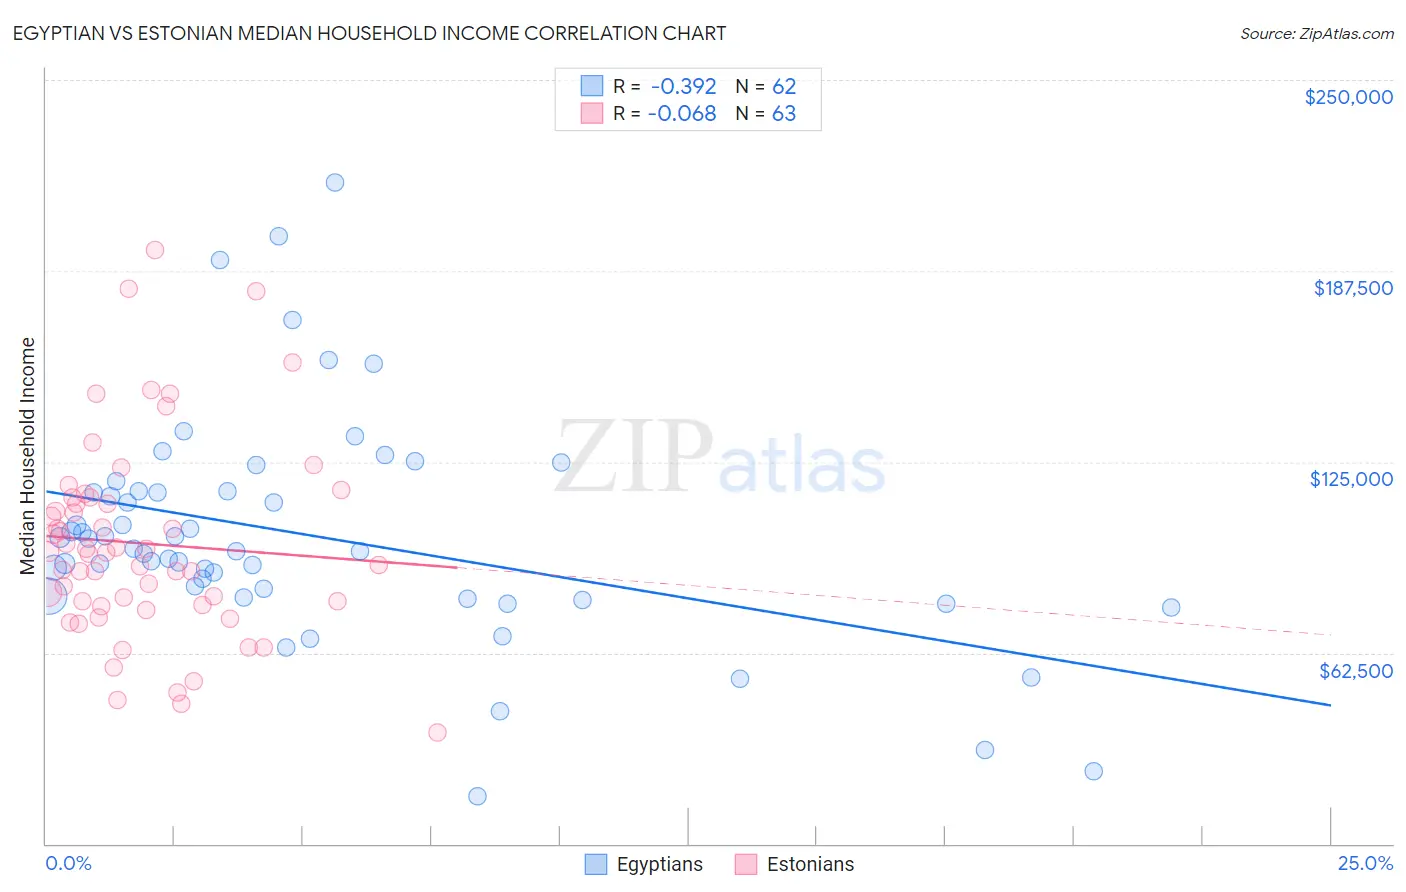
Egyptian vs Estonian Median Household Income Correlation Chart
The statistical analysis conducted on geographies consisting of 276,717,695 people shows a mild negative correlation between the proportion of Egyptians and median household income in the United States with a correlation coefficient (R) of -0.392 and weighted average of $95,673. Similarly, the statistical analysis conducted on geographies consisting of 123,471,102 people shows a slight negative correlation between the proportion of Estonians and median household income in the United States with a correlation coefficient (R) of -0.068 and weighted average of $95,930, a difference of 0.27%.
Median Household Income Correlation Summary
| Measurement | Egyptian | Estonian |
| Minimum | $15,682 | $36,563 |
| Maximum | $216,495 | $194,375 |
| Range | $200,813 | $157,812 |
| Mean | $100,993 | $98,343 |
| Median | $96,117 | $95,522 |
| Interquartile 25% (IQ1) | $81,164 | $78,091 |
| Interquartile 75% (IQ3) | $115,184 | $113,403 |
| Interquartile Range (IQR) | $34,020 | $35,312 |
| Standard Deviation (Sample) | $37,055 | $32,504 |
| Standard Deviation (Population) | $36,755 | $32,245 |
Demographics Similar to Egyptians and Estonians by Median Household Income
In terms of median household income, the demographic groups most similar to Egyptians are Paraguayan ($95,737, a difference of 0.070%), Immigrants from South Africa ($95,800, a difference of 0.13%), Immigrants from Czechoslovakia ($95,319, a difference of 0.37%), Immigrants from Austria ($95,277, a difference of 0.42%), and New Zealander ($95,146, a difference of 0.55%). Similarly, the demographic groups most similar to Estonians are Immigrants from South Africa ($95,800, a difference of 0.14%), Paraguayan ($95,737, a difference of 0.20%), Immigrants from Malaysia ($96,292, a difference of 0.38%), Bulgarian ($96,290, a difference of 0.38%), and Cambodian ($96,324, a difference of 0.41%).
| Demographics | Rating | Rank | Median Household Income |
| Immigrants | Lithuania | 99.9 /100 | #42 | Exceptional $96,836 |
| Immigrants | France | 99.9 /100 | #43 | Exceptional $96,743 |
| Immigrants | Greece | 99.9 /100 | #44 | Exceptional $96,675 |
| Israelis | 99.9 /100 | #45 | Exceptional $96,552 |
| Australians | 99.9 /100 | #46 | Exceptional $96,490 |
| Immigrants | Russia | 99.9 /100 | #47 | Exceptional $96,378 |
| Cambodians | 99.9 /100 | #48 | Exceptional $96,324 |
| Immigrants | Malaysia | 99.9 /100 | #49 | Exceptional $96,292 |
| Bulgarians | 99.9 /100 | #50 | Exceptional $96,290 |
| Estonians | 99.9 /100 | #51 | Exceptional $95,930 |
| Immigrants | South Africa | 99.9 /100 | #52 | Exceptional $95,800 |
| Paraguayans | 99.9 /100 | #53 | Exceptional $95,737 |
| Egyptians | 99.9 /100 | #54 | Exceptional $95,673 |
| Immigrants | Czechoslovakia | 99.9 /100 | #55 | Exceptional $95,319 |
| Immigrants | Austria | 99.9 /100 | #56 | Exceptional $95,277 |
| New Zealanders | 99.8 /100 | #57 | Exceptional $95,146 |
| Soviet Union | 99.8 /100 | #58 | Exceptional $95,098 |
| Immigrants | Europe | 99.8 /100 | #59 | Exceptional $95,032 |
| Koreans | 99.8 /100 | #60 | Exceptional $95,018 |
| Laotians | 99.8 /100 | #61 | Exceptional $94,990 |
| Immigrants | Norway | 99.8 /100 | #62 | Exceptional $94,846 |