Ecuadorian vs Subsaharan African Per Capita Income
COMPARE
Ecuadorian
Subsaharan African
Per Capita Income
Per Capita Income Comparison
Ecuadorians
Sub-Saharan Africans
$41,958
PER CAPITA INCOME
12.9/ 100
METRIC RATING
210th/ 347
METRIC RANK
$40,152
PER CAPITA INCOME
1.9/ 100
METRIC RATING
245th/ 347
METRIC RANK
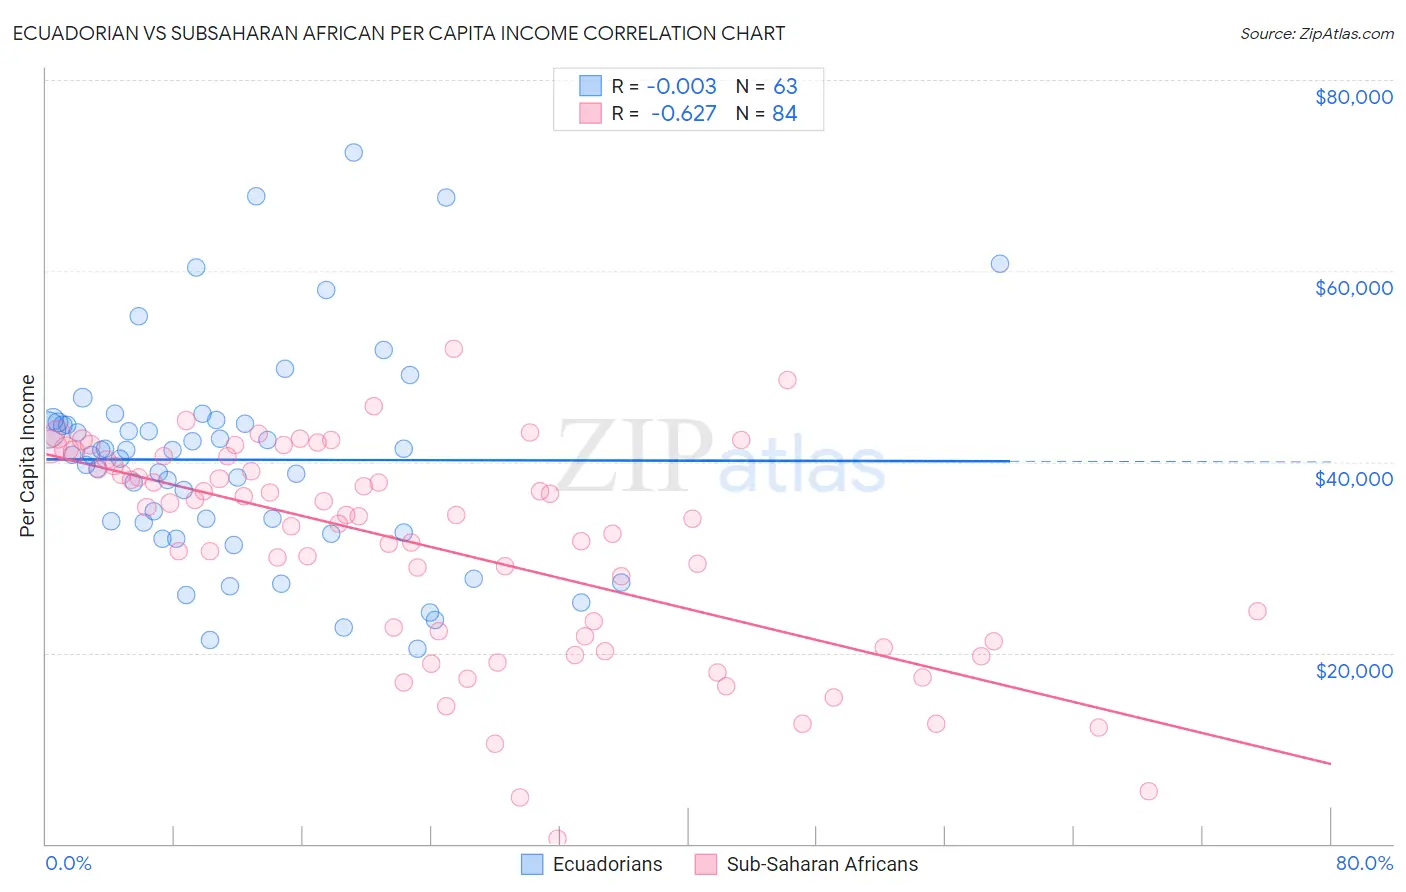
Ecuadorian vs Subsaharan African Per Capita Income Correlation Chart
The statistical analysis conducted on geographies consisting of 317,868,656 people shows no correlation between the proportion of Ecuadorians and per capita income in the United States with a correlation coefficient (R) of -0.003 and weighted average of $41,958. Similarly, the statistical analysis conducted on geographies consisting of 508,279,002 people shows a significant negative correlation between the proportion of Sub-Saharan Africans and per capita income in the United States with a correlation coefficient (R) of -0.627 and weighted average of $40,152, a difference of 4.5%.
Per Capita Income Correlation Summary
| Measurement | Ecuadorian | Subsaharan African |
| Minimum | $20,380 | $461 |
| Maximum | $72,406 | $51,790 |
| Range | $52,026 | $51,329 |
| Mean | $40,218 | $31,049 |
| Median | $40,771 | $34,354 |
| Interquartile 25% (IQ1) | $32,581 | $21,454 |
| Interquartile 75% (IQ3) | $44,161 | $39,919 |
| Interquartile Range (IQR) | $11,580 | $18,464 |
| Standard Deviation (Sample) | $11,145 | $11,215 |
| Standard Deviation (Population) | $11,056 | $11,148 |
Similar Demographics by Per Capita Income
Demographics Similar to Ecuadorians by Per Capita Income
In terms of per capita income, the demographic groups most similar to Ecuadorians are Immigrants from Sudan ($41,986, a difference of 0.070%), Panamanian ($42,035, a difference of 0.18%), Immigrants from Panama ($41,853, a difference of 0.25%), Venezuelan ($42,074, a difference of 0.28%), and Immigrants from Senegal ($41,830, a difference of 0.30%).
| Demographics | Rating | Rank | Per Capita Income |
| Spanish | 17.0 /100 | #203 | Poor $42,249 |
| Aleuts | 16.4 /100 | #204 | Poor $42,210 |
| Whites/Caucasians | 15.9 /100 | #205 | Poor $42,180 |
| Ghanaians | 15.7 /100 | #206 | Poor $42,164 |
| Venezuelans | 14.4 /100 | #207 | Poor $42,074 |
| Panamanians | 13.9 /100 | #208 | Poor $42,035 |
| Immigrants | Sudan | 13.2 /100 | #209 | Poor $41,986 |
| Ecuadorians | 12.9 /100 | #210 | Poor $41,958 |
| Immigrants | Panama | 11.6 /100 | #211 | Poor $41,853 |
| Immigrants | Senegal | 11.3 /100 | #212 | Poor $41,830 |
| Immigrants | Venezuela | 10.2 /100 | #213 | Poor $41,727 |
| Immigrants | Bangladesh | 10.1 /100 | #214 | Poor $41,709 |
| Sudanese | 9.9 /100 | #215 | Tragic $41,695 |
| Tongans | 9.9 /100 | #216 | Tragic $41,693 |
| Guamanians/Chamorros | 9.7 /100 | #217 | Tragic $41,678 |
Demographics Similar to Sub-Saharan Africans by Per Capita Income
In terms of per capita income, the demographic groups most similar to Sub-Saharan Africans are French American Indian ($40,244, a difference of 0.23%), Cree ($40,056, a difference of 0.24%), German Russian ($40,266, a difference of 0.28%), Immigrants from Western Africa ($40,294, a difference of 0.35%), and British West Indian ($40,330, a difference of 0.44%).
| Demographics | Rating | Rank | Per Capita Income |
| Somalis | 2.4 /100 | #238 | Tragic $40,367 |
| Tsimshian | 2.4 /100 | #239 | Tragic $40,344 |
| Immigrants | Nigeria | 2.3 /100 | #240 | Tragic $40,339 |
| British West Indians | 2.3 /100 | #241 | Tragic $40,330 |
| Immigrants | Western Africa | 2.2 /100 | #242 | Tragic $40,294 |
| German Russians | 2.2 /100 | #243 | Tragic $40,266 |
| French American Indians | 2.1 /100 | #244 | Tragic $40,244 |
| Sub-Saharan Africans | 1.9 /100 | #245 | Tragic $40,152 |
| Cree | 1.7 /100 | #246 | Tragic $40,056 |
| Immigrants | Somalia | 1.6 /100 | #247 | Tragic $39,974 |
| Cape Verdeans | 1.5 /100 | #248 | Tragic $39,935 |
| Japanese | 1.4 /100 | #249 | Tragic $39,870 |
| Immigrants | Burma/Myanmar | 1.3 /100 | #250 | Tragic $39,827 |
| Samoans | 1.3 /100 | #251 | Tragic $39,826 |
| Immigrants | Azores | 1.0 /100 | #252 | Tragic $39,608 |