Ecuadorian vs Argentinean Householder Income Under 25 years
COMPARE
Ecuadorian
Argentinean
Householder Income Under 25 years
Householder Income Under 25 years Comparison
Ecuadorians
Argentineans
$53,911
HOUSEHOLDER INCOME UNDER 25 YEARS
98.5/ 100
METRIC RATING
102nd/ 347
METRIC RANK
$54,154
HOUSEHOLDER INCOME UNDER 25 YEARS
99.2/ 100
METRIC RATING
96th/ 347
METRIC RANK
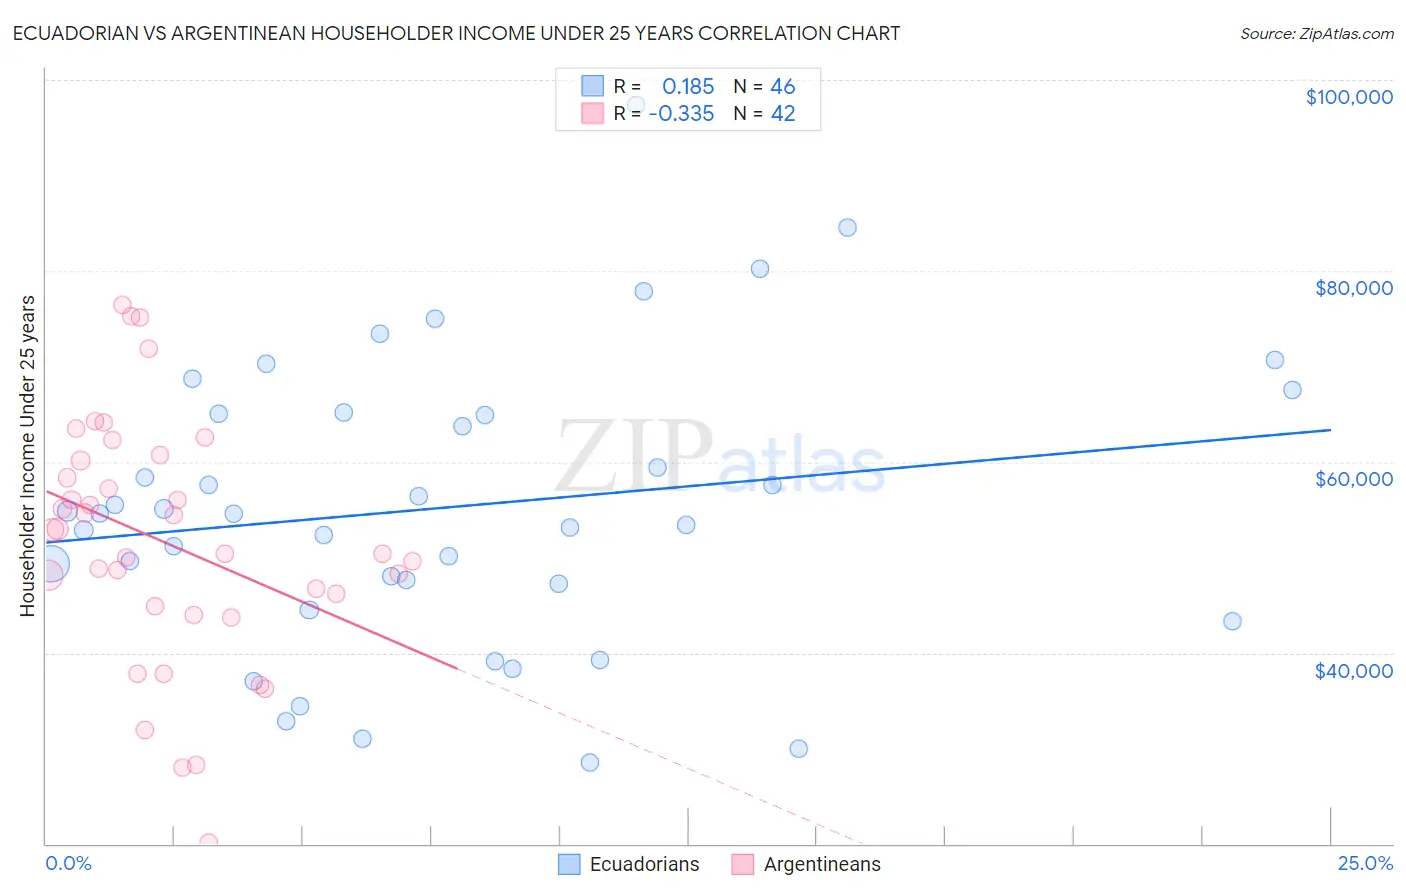
Ecuadorian vs Argentinean Householder Income Under 25 years Correlation Chart
The statistical analysis conducted on geographies consisting of 271,738,098 people shows a poor positive correlation between the proportion of Ecuadorians and household income with householder under the age of 25 in the United States with a correlation coefficient (R) of 0.185 and weighted average of $53,911. Similarly, the statistical analysis conducted on geographies consisting of 257,126,127 people shows a mild negative correlation between the proportion of Argentineans and household income with householder under the age of 25 in the United States with a correlation coefficient (R) of -0.335 and weighted average of $54,154, a difference of 0.45%.
Householder Income Under 25 years Correlation Summary
| Measurement | Ecuadorian | Argentinean |
| Minimum | $28,576 | $20,094 |
| Maximum | $97,399 | $76,444 |
| Range | $68,823 | $56,350 |
| Mean | $55,256 | $51,569 |
| Median | $54,589 | $51,595 |
| Interquartile 25% (IQ1) | $47,259 | $44,853 |
| Interquartile 75% (IQ3) | $65,102 | $60,142 |
| Interquartile Range (IQR) | $17,843 | $15,290 |
| Standard Deviation (Sample) | $15,099 | $12,822 |
| Standard Deviation (Population) | $14,934 | $12,668 |
Demographics Similar to Ecuadorians and Argentineans by Householder Income Under 25 years
In terms of householder income under 25 years, the demographic groups most similar to Ecuadorians are South American ($53,939, a difference of 0.050%), Ukrainian ($53,843, a difference of 0.13%), Immigrants from Kazakhstan ($53,990, a difference of 0.15%), Alaska Native ($54,000, a difference of 0.16%), and Ethiopian ($53,818, a difference of 0.17%). Similarly, the demographic groups most similar to Argentineans are Immigrants from Malaysia ($54,179, a difference of 0.050%), Immigrants from Sierra Leone ($54,190, a difference of 0.070%), Immigrants from Portugal ($54,105, a difference of 0.090%), Immigrants from Argentina ($54,209, a difference of 0.10%), and Immigrants from St. Vincent and the Grenadines ($54,230, a difference of 0.14%).
| Demographics | Rating | Rank | Householder Income Under 25 years |
| Immigrants | South America | 99.4 /100 | #89 | Exceptional $54,268 |
| Turks | 99.4 /100 | #90 | Exceptional $54,266 |
| Immigrants | Egypt | 99.3 /100 | #91 | Exceptional $54,239 |
| Immigrants | St. Vincent and the Grenadines | 99.3 /100 | #92 | Exceptional $54,230 |
| Immigrants | Argentina | 99.3 /100 | #93 | Exceptional $54,209 |
| Immigrants | Sierra Leone | 99.3 /100 | #94 | Exceptional $54,190 |
| Immigrants | Malaysia | 99.2 /100 | #95 | Exceptional $54,179 |
| Argentineans | 99.2 /100 | #96 | Exceptional $54,154 |
| Immigrants | Portugal | 99.1 /100 | #97 | Exceptional $54,105 |
| Eastern Europeans | 99.0 /100 | #98 | Exceptional $54,066 |
| Alaska Natives | 98.8 /100 | #99 | Exceptional $54,000 |
| Immigrants | Kazakhstan | 98.8 /100 | #100 | Exceptional $53,990 |
| South Americans | 98.6 /100 | #101 | Exceptional $53,939 |
| Ecuadorians | 98.5 /100 | #102 | Exceptional $53,911 |
| Ukrainians | 98.3 /100 | #103 | Exceptional $53,843 |
| Ethiopians | 98.2 /100 | #104 | Exceptional $53,818 |
| Immigrants | France | 98.1 /100 | #105 | Exceptional $53,805 |
| Albanians | 98.1 /100 | #106 | Exceptional $53,794 |
| Australians | 97.8 /100 | #107 | Exceptional $53,739 |
| Maltese | 97.8 /100 | #108 | Exceptional $53,735 |
| Immigrants | Ecuador | 97.7 /100 | #109 | Exceptional $53,722 |