Eastern European vs Immigrants from Haiti Median Earnings
COMPARE
Eastern European
Immigrants from Haiti
Median Earnings
Median Earnings Comparison
Eastern Europeans
Immigrants from Haiti
$55,084
MEDIAN EARNINGS
100.0/ 100
METRIC RATING
17th/ 347
METRIC RANK
$40,550
MEDIAN EARNINGS
0.0/ 100
METRIC RATING
309th/ 347
METRIC RANK
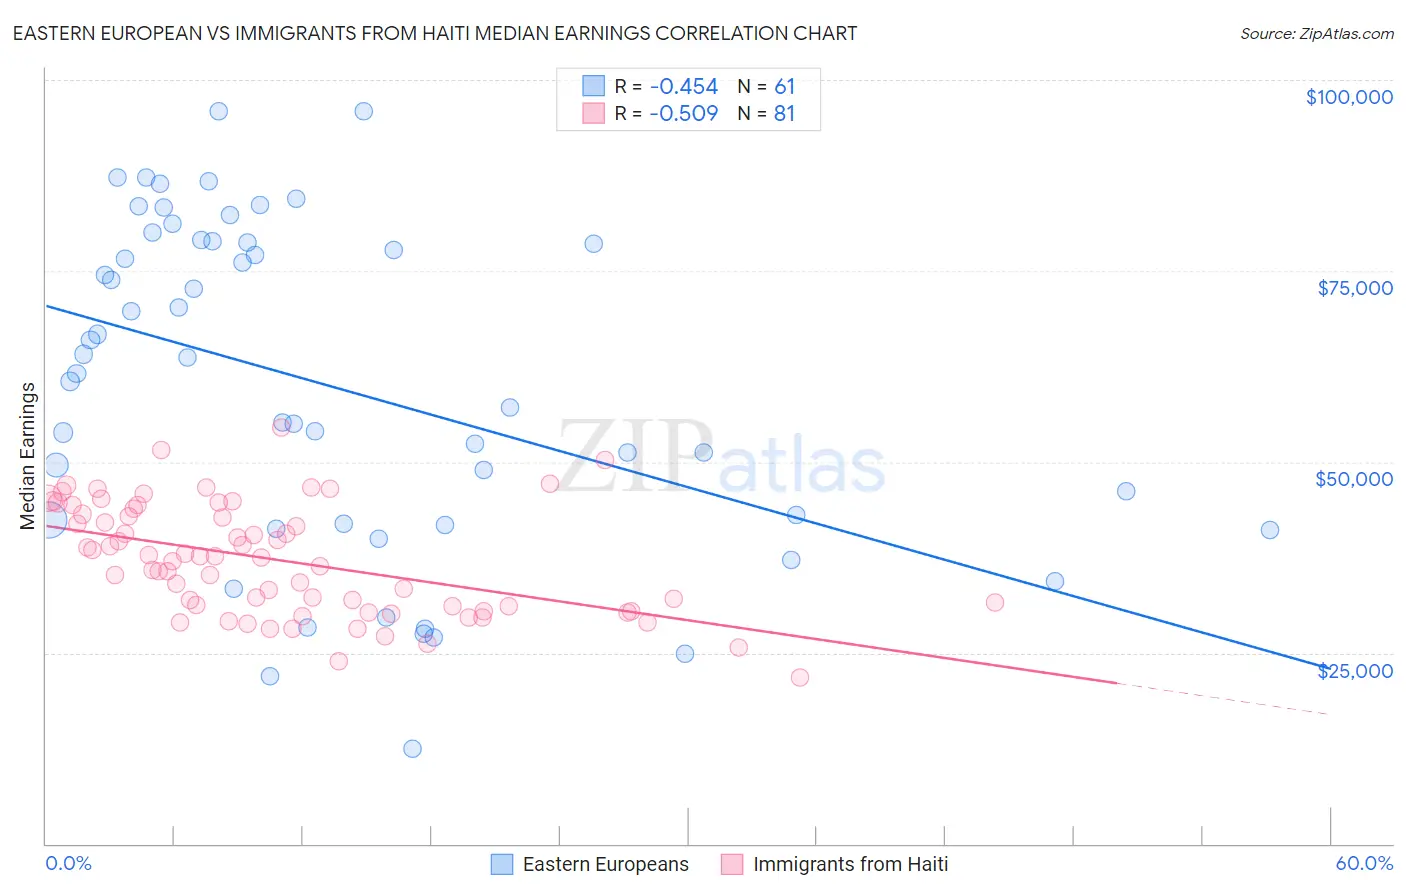
Eastern European vs Immigrants from Haiti Median Earnings Correlation Chart
The statistical analysis conducted on geographies consisting of 461,197,031 people shows a moderate negative correlation between the proportion of Eastern Europeans and median earnings in the United States with a correlation coefficient (R) of -0.454 and weighted average of $55,084. Similarly, the statistical analysis conducted on geographies consisting of 225,267,709 people shows a substantial negative correlation between the proportion of Immigrants from Haiti and median earnings in the United States with a correlation coefficient (R) of -0.509 and weighted average of $40,550, a difference of 35.8%.
Median Earnings Correlation Summary
| Measurement | Eastern European | Immigrants from Haiti |
| Minimum | $12,500 | $21,741 |
| Maximum | $95,935 | $54,545 |
| Range | $83,435 | $32,804 |
| Mean | $59,916 | $37,122 |
| Median | $61,581 | $37,540 |
| Interquartile 25% (IQ1) | $41,817 | $30,770 |
| Interquartile 75% (IQ3) | $78,787 | $43,463 |
| Interquartile Range (IQR) | $36,970 | $12,693 |
| Standard Deviation (Sample) | $21,428 | $7,185 |
| Standard Deviation (Population) | $21,251 | $7,140 |
Similar Demographics by Median Earnings
Demographics Similar to Eastern Europeans by Median Earnings
In terms of median earnings, the demographic groups most similar to Eastern Europeans are Immigrants from Japan ($54,938, a difference of 0.26%), Immigrants from Belgium ($54,679, a difference of 0.74%), Cypriot ($54,589, a difference of 0.91%), Burmese ($54,559, a difference of 0.96%), and Immigrants from Korea ($54,530, a difference of 1.0%).
| Demographics | Rating | Rank | Median Earnings |
| Immigrants | South Central Asia | 100.0 /100 | #10 | Exceptional $57,114 |
| Immigrants | Israel | 100.0 /100 | #11 | Exceptional $57,034 |
| Immigrants | Ireland | 100.0 /100 | #12 | Exceptional $56,854 |
| Immigrants | China | 100.0 /100 | #13 | Exceptional $56,638 |
| Immigrants | Australia | 100.0 /100 | #14 | Exceptional $56,305 |
| Indians (Asian) | 100.0 /100 | #15 | Exceptional $56,253 |
| Immigrants | Eastern Asia | 100.0 /100 | #16 | Exceptional $56,183 |
| Eastern Europeans | 100.0 /100 | #17 | Exceptional $55,084 |
| Immigrants | Japan | 100.0 /100 | #18 | Exceptional $54,938 |
| Immigrants | Belgium | 100.0 /100 | #19 | Exceptional $54,679 |
| Cypriots | 100.0 /100 | #20 | Exceptional $54,589 |
| Burmese | 100.0 /100 | #21 | Exceptional $54,559 |
| Immigrants | Korea | 100.0 /100 | #22 | Exceptional $54,530 |
| Immigrants | Sweden | 100.0 /100 | #23 | Exceptional $54,478 |
| Soviet Union | 100.0 /100 | #24 | Exceptional $54,290 |
Demographics Similar to Immigrants from Haiti by Median Earnings
In terms of median earnings, the demographic groups most similar to Immigrants from Haiti are Cuban ($40,619, a difference of 0.17%), Honduran ($40,638, a difference of 0.22%), Yaqui ($40,647, a difference of 0.24%), Chickasaw ($40,672, a difference of 0.30%), and Apache ($40,388, a difference of 0.40%).
| Demographics | Rating | Rank | Median Earnings |
| Shoshone | 0.0 /100 | #302 | Tragic $40,932 |
| Haitians | 0.0 /100 | #303 | Tragic $40,918 |
| Immigrants | Guatemala | 0.0 /100 | #304 | Tragic $40,851 |
| Chickasaw | 0.0 /100 | #305 | Tragic $40,672 |
| Yaqui | 0.0 /100 | #306 | Tragic $40,647 |
| Hondurans | 0.0 /100 | #307 | Tragic $40,638 |
| Cubans | 0.0 /100 | #308 | Tragic $40,619 |
| Immigrants | Haiti | 0.0 /100 | #309 | Tragic $40,550 |
| Apache | 0.0 /100 | #310 | Tragic $40,388 |
| Hispanics or Latinos | 0.0 /100 | #311 | Tragic $40,288 |
| Chippewa | 0.0 /100 | #312 | Tragic $40,287 |
| Choctaw | 0.0 /100 | #313 | Tragic $40,270 |
| Cheyenne | 0.0 /100 | #314 | Tragic $40,233 |
| Seminole | 0.0 /100 | #315 | Tragic $40,233 |
| Immigrants | Honduras | 0.0 /100 | #316 | Tragic $40,195 |