Eastern European vs Immigrants from Czechoslovakia Householder Income Ages 45 - 64 years

COMPARE

Eastern European
Race
Ancestry
AfghanAfricanAlaska NativeAlaskan AthabascanAlbanianAleutAlsatianAmericanApacheArabArapahoArgentineanArmenianAssyrian/Chaldean/SyriacAustralianAustrianBahamianBangladeshiBarbadianBasqueBelgianBelizeanBermudanBhutaneseBlackfeetBolivianBrazilianBritishBritish West IndianBulgarianBurmeseCajunCambodianCanadianCape VerdeanCarpatho RusynCelticCentral AmericanCentral American IndianCherokeeCheyenneChickasawChileanChineseChippewaChoctawColombianColvilleComancheCosta RicanCreeCreekCroatianCrowCubanCypriotCzechCzechoslovakianDanishDelawareDominicanDutchDutch West IndianEastern EuropeanEcuadorianEgyptianEnglishEstonianEthiopianEuropeanFijianFilipinoFinnishFrenchFrench American IndianFrench CanadianGermanGerman RussianGhanaianGreekGuamanian/ChamorroGuatemalanGuyaneseHaitianHmongHonduranHopiHoumaHungarianIcelanderIndian (Asian)IndonesianInupiatIranianIraqiIrishIroquoisIsraeliItalianJamaicanJapaneseJordanianKenyanKiowaKoreanLaotianLatvianLebaneseLiberianLithuanianLumbeeLuxembourgerMacedonianMalaysianMalteseMarshalleseMenomineeMexicanMexican American IndianMongolianMoroccanNative HawaiianNavajoNepaleseNew ZealanderNicaraguanNigerianNorthern EuropeanNorwegianOkinawanOsageOttawaPaiutePakistaniPalestinianPanamanianParaguayanPennsylvania GermanPeruvianPimaPolishPortuguesePotawatomiPuebloPuerto RicanPuget Sound SalishRomanianRussianSalvadoranSamoanScandinavianScotch-IrishScottishSeminoleSenegaleseSerbianShoshoneSierra LeoneanSiouxSlavicSlovakSloveneSomaliSouth AfricanSouth AmericanSouth American IndianSoviet UnionSpaniardSpanishSpanish AmericanSpanish American IndianSri LankanSubsaharan AfricanSudaneseSwedishSwissSyrianTaiwaneseThaiTlingit-HaidaTohono O'OdhamTonganTrinidadian and TobagonianTsimshianTurkishU.S. Virgin IslanderUgandanUkrainianUruguayanUteVenezuelanVietnameseWelshWest IndianYakamaYaquiYugoslavianYumanYup'ikZimbabwean
Immigration
NonimmigrantsImmigrantsAfghanistanAfricaAlbaniaArgentinaArmeniaAsiaAustraliaAustriaBahamasBangladeshBarbadosBelarusBelgiumBelizeBoliviaBosnia and HerzegovinaBrazilBulgariaBurma/MyanmarCabo VerdeCambodiaCameroonCanadaCaribbeanCentral AmericaChileChinaColombiaCongoCosta RicaCroatiaCubaDenmarkDominicaDominican RepublicEastern AfricaEastern AsiaEastern EuropeEcuadorEgyptEl SalvadorEnglandEritreaEthiopiaEuropeFijiFranceGermanyGhanaGreeceGrenadaGuatemalaGuyanaHaitiHondurasHong KongHungaryIndiaIndonesiaIranIraqIrelandIsraelItalyJamaicaJapanJordanKazakhstanKenyaKoreaKuwaitLaosLatin AmericaLatviaLebanonLiberiaLithuaniaMalaysiaMexicoMicronesiaMiddle AfricaMoldovaMoroccoNepalNetherlandsNicaraguaNigeriaNorth AmericaNorth MacedoniaNorthern AfricaNorthern EuropeNorwayOceaniaPakistanPanamaPeruPhilippinesPolandPortugalRomaniaRussiaSaudi ArabiaScotlandSenegalSerbiaSierra LeoneSingaporeSomaliaSouth AfricaSouth AmericaSouth Central AsiaSouth Eastern AsiaSouthern EuropeSpainSri LankaSt. Vincent and the GrenadinesSudanSwedenSwitzerlandSyriaTaiwanThailandTrinidad and TobagoTurkeyUgandaUkraineUruguayUzbekistanVenezuelaVietnamWest IndiesWestern AfricaWestern AsiaWestern EuropeYemenZaireZimbabweAzores
Immigrants from Czechoslovakia
Race
Ancestry
AfghanAfricanAlaska NativeAlaskan AthabascanAlbanianAleutAlsatianAmericanApacheArabArapahoArgentineanArmenianAssyrian/Chaldean/SyriacAustralianAustrianBahamianBangladeshiBarbadianBasqueBelgianBelizeanBermudanBhutaneseBlackfeetBolivianBrazilianBritishBritish West IndianBulgarianBurmeseCajunCambodianCanadianCape VerdeanCarpatho RusynCelticCentral AmericanCentral American IndianCherokeeCheyenneChickasawChileanChineseChippewaChoctawColombianColvilleComancheCosta RicanCreeCreekCroatianCrowCubanCypriotCzechCzechoslovakianDanishDelawareDominicanDutchDutch West IndianEcuadorianEgyptianEnglishEstonianEthiopianEuropeanFijianFilipinoFinnishFrenchFrench American IndianFrench CanadianGermanGerman RussianGhanaianGreekGuamanian/ChamorroGuatemalanGuyaneseHaitianHmongHonduranHopiHoumaHungarianIcelanderIndian (Asian)IndonesianInupiatIranianIraqiIrishIroquoisIsraeliItalianJamaicanJapaneseJordanianKenyanKiowaKoreanLaotianLatvianLebaneseLiberianLithuanianLumbeeLuxembourgerMacedonianMalaysianMalteseMarshalleseMenomineeMexicanMexican American IndianMongolianMoroccanNative HawaiianNavajoNepaleseNew ZealanderNicaraguanNigerianNorthern EuropeanNorwegianOkinawanOsageOttawaPaiutePakistaniPalestinianPanamanianParaguayanPennsylvania GermanPeruvianPimaPolishPortuguesePotawatomiPuebloPuerto RicanPuget Sound SalishRomanianRussianSalvadoranSamoanScandinavianScotch-IrishScottishSeminoleSenegaleseSerbianShoshoneSierra LeoneanSiouxSlavicSlovakSloveneSomaliSouth AfricanSouth AmericanSouth American IndianSoviet UnionSpaniardSpanishSpanish AmericanSpanish American IndianSri LankanSubsaharan AfricanSudaneseSwedishSwissSyrianTaiwaneseThaiTlingit-HaidaTohono O'OdhamTonganTrinidadian and TobagonianTsimshianTurkishU.S. Virgin IslanderUgandanUkrainianUruguayanUteVenezuelanVietnameseWelshWest IndianYakamaYaquiYugoslavianYumanYup'ikZimbabwean
Immigration
NonimmigrantsImmigrantsAfghanistanAfricaAlbaniaArgentinaArmeniaAsiaAustraliaAustriaBahamasBangladeshBarbadosBelarusBelgiumBelizeBoliviaBosnia and HerzegovinaBrazilBulgariaBurma/MyanmarCabo VerdeCambodiaCameroonCanadaCaribbeanCentral AmericaChileChinaColombiaCongoCosta RicaCroatiaCubaCzechoslovakiaDenmarkDominicaDominican RepublicEastern AfricaEastern AsiaEastern EuropeEcuadorEgyptEl SalvadorEnglandEritreaEthiopiaEuropeFijiFranceGermanyGhanaGreeceGrenadaGuatemalaGuyanaHaitiHondurasHong KongHungaryIndiaIndonesiaIranIraqIrelandIsraelItalyJamaicaJapanJordanKazakhstanKenyaKoreaKuwaitLaosLatin AmericaLatviaLebanonLiberiaLithuaniaMalaysiaMexicoMicronesiaMiddle AfricaMoldovaMoroccoNepalNetherlandsNicaraguaNigeriaNorth AmericaNorth MacedoniaNorthern AfricaNorthern EuropeNorwayOceaniaPakistanPanamaPeruPhilippinesPolandPortugalRomaniaRussiaSaudi ArabiaScotlandSenegalSerbiaSierra LeoneSingaporeSomaliaSouth AfricaSouth AmericaSouth Central AsiaSouth Eastern AsiaSouthern EuropeSpainSri LankaSt. Vincent and the GrenadinesSudanSwedenSwitzerlandSyriaTaiwanThailandTrinidad and TobagoTurkeyUgandaUkraineUruguayUzbekistanVenezuelaVietnamWest IndiesWestern AfricaWestern AsiaWestern EuropeYemenZaireZimbabweAzores
Householder Income Ages 45 - 64 years
Income
Poverty
Unemployment
Labor Participation
Family Structure
Vehicle Availability
Education Level
Disability

Householder Income Ages 45 - 64 years Comparison

Eastern Europeans

Immigrants from Czechoslovakia

Exceptional
Exceptional
$120,684
HOUSEHOLDER INCOME AGES 45 - 64 YEARS
100.0/ 100
METRIC RATING
19th/ 347
METRIC RANK
$111,914
HOUSEHOLDER INCOME AGES 45 - 64 YEARS
99.7/ 100
METRIC RATING
61st/ 347
METRIC RANK

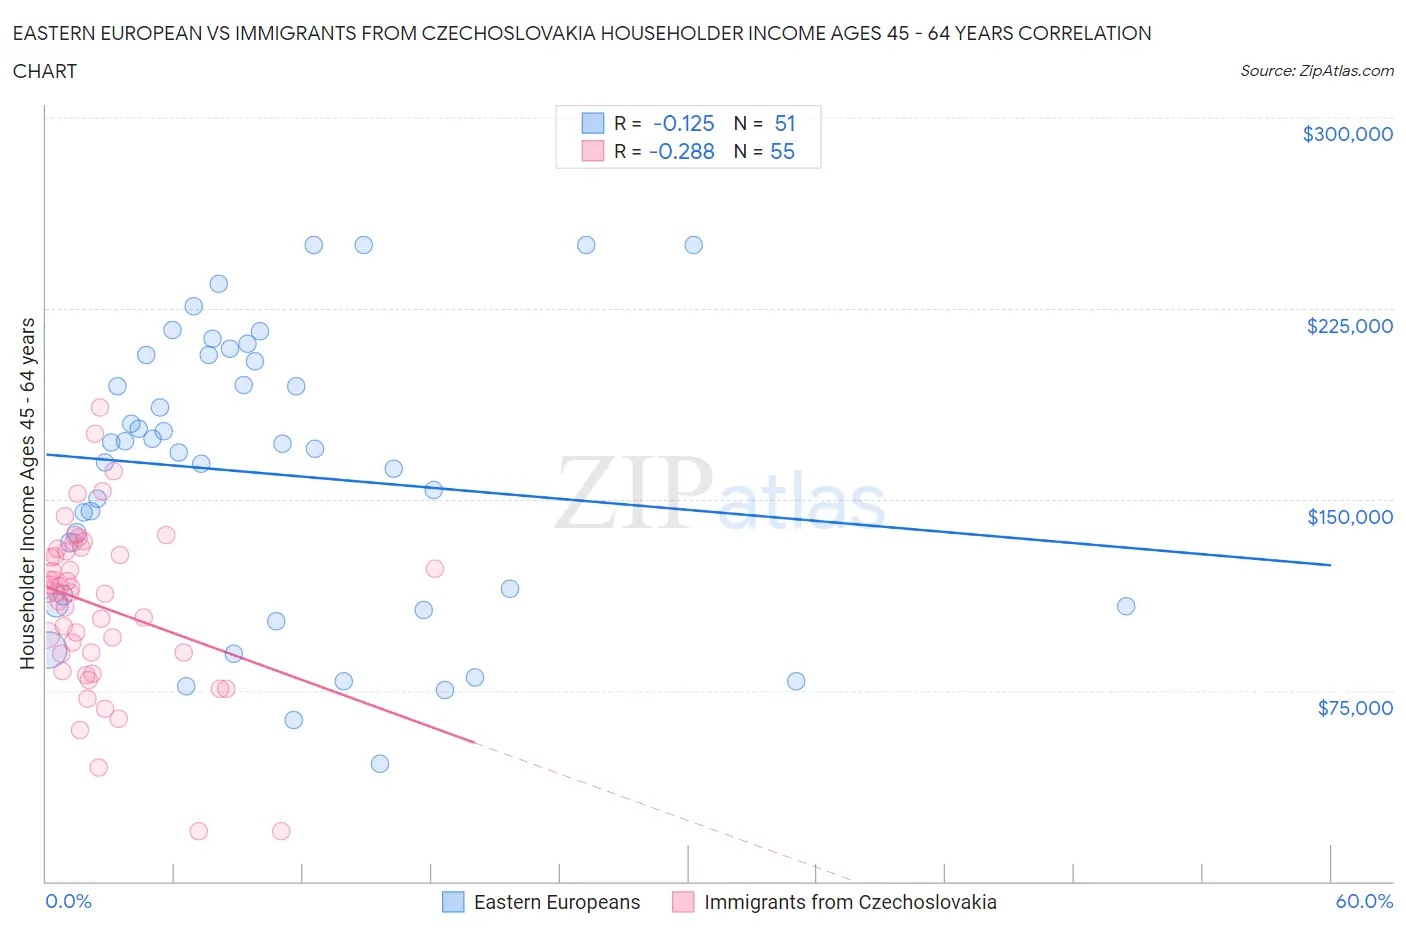
Eastern European vs Immigrants from Czechoslovakia Householder Income Ages 45 - 64 years Correlation Chart

The statistical analysis conducted on geographies consisting of 460,234,248 people shows a poor negative correlation between the proportion of Eastern Europeans and household income with householder between the ages 45 and 64 in the United States with a correlation coefficient (R) of -0.125 and weighted average of $120,684. Similarly, the statistical analysis conducted on geographies consisting of 195,371,868 people shows a weak negative correlation between the proportion of Immigrants from Czechoslovakia and household income with householder between the ages 45 and 64 in the United States with a correlation coefficient (R) of -0.288 and weighted average of $111,914, a difference of 7.8%.
Eastern European vs Immigrants from Czechoslovakia Householder Income Ages 45 - 64 years

Householder Income Ages 45 - 64 years Correlation Summary

MeasurementEastern EuropeanImmigrants from Czechoslovakia
Minimum$46,087$19,531
Maximum$250,001$185,944
Range$203,914$166,413
Mean$160,074$108,047
Median$169,721$113,601
Interquartile 25% (IQ1)$108,414$89,542
Interquartile 75% (IQ3)$206,658$129,527
Interquartile Range (IQR)$98,244$39,985
Standard Deviation (Sample)$55,229$33,291
Standard Deviation (Population)$54,685$32,987

Similar Demographics by Householder Income Ages 45 - 64 years

Demographics Similar to Eastern Europeans by Householder Income Ages 45 - 64 years

In terms of householder income ages 45 - 64 years, the demographic groups most similar to Eastern Europeans are Immigrants from Korea ($121,243, a difference of 0.46%), Burmese ($121,444, a difference of 0.63%), Immigrants from Australia ($119,308, a difference of 1.1%), Immigrants from China ($122,178, a difference of 1.2%), and Immigrants from Eastern Asia ($122,222, a difference of 1.3%).
DemographicsRating | RankHouseholder Income Ages 45 - 64 years
Immigrants | Israel
100.0
/100
|
#12
Exceptional
$122,893
Immigrants | Ireland
100.0
/100
|
#13
Exceptional
$122,757
Indians (Asian)
100.0
/100
|
#14
Exceptional
$122,343
Immigrants | Eastern Asia
100.0
/100
|
#15
Exceptional
$122,222
Immigrants | China
100.0
/100
|
#16
Exceptional
$122,178
Burmese
100.0
/100
|
#17
Exceptional
$121,444
Immigrants | Korea
100.0
/100
|
#18
Exceptional
$121,243
Eastern Europeans
100.0
/100
|
#19
Exceptional
$120,684
Immigrants | Australia
100.0
/100
|
#20
Exceptional
$119,308
Immigrants | Sri Lanka
100.0
/100
|
#21
Exceptional
$119,094
Immigrants | Belgium
100.0
/100
|
#22
Exceptional
$118,932
Bolivians
100.0
/100
|
#23
Exceptional
$118,871
Immigrants | Japan
100.0
/100
|
#24
Exceptional
$118,498
Asians
100.0
/100
|
#25
Exceptional
$118,426
Immigrants | Sweden
100.0
/100
|
#26
Exceptional
$118,318

Demographics Similar to Immigrants from Czechoslovakia by Householder Income Ages 45 - 64 years

In terms of householder income ages 45 - 64 years, the demographic groups most similar to Immigrants from Czechoslovakia are Immigrants from Europe ($111,984, a difference of 0.060%), Immigrants from Netherlands ($111,982, a difference of 0.060%), Soviet Union ($112,008, a difference of 0.080%), Immigrants from Norway ($111,669, a difference of 0.22%), and Immigrants from Scotland ($112,175, a difference of 0.23%).
DemographicsRating | RankHouseholder Income Ages 45 - 64 years
Greeks
99.8
/100
|
#54
Exceptional
$112,630
Lithuanians
99.8
/100
|
#55
Exceptional
$112,484
Egyptians
99.7
/100
|
#56
Exceptional
$112,256
Immigrants | Scotland
99.7
/100
|
#57
Exceptional
$112,175
Soviet Union
99.7
/100
|
#58
Exceptional
$112,008
Immigrants | Europe
99.7
/100
|
#59
Exceptional
$111,984
Immigrants | Netherlands
99.7
/100
|
#60
Exceptional
$111,982
Immigrants | Czechoslovakia
99.7
/100
|
#61
Exceptional
$111,914
Immigrants | Norway
99.7
/100
|
#62
Exceptional
$111,669
Mongolians
99.6
/100
|
#63
Exceptional
$111,602
Immigrants | Latvia
99.6
/100
|
#64
Exceptional
$111,454
Immigrants | Belarus
99.6
/100
|
#65
Exceptional
$111,430
New Zealanders
99.6
/100
|
#66
Exceptional
$111,286
Laotians
99.5
/100
|
#67
Exceptional
$111,051
Immigrants | Romania
99.4
/100
|
#68
Exceptional
$110,633