Dutch West Indian vs Immigrants from Netherlands Median Earnings
COMPARE
Dutch West Indian
Immigrants from Netherlands
Median Earnings
Median Earnings Comparison
Dutch West Indians
Immigrants from Netherlands
$40,107
MEDIAN EARNINGS
0.0/ 100
METRIC RATING
318th/ 347
METRIC RANK
$50,818
MEDIAN EARNINGS
99.8/ 100
METRIC RATING
73rd/ 347
METRIC RANK
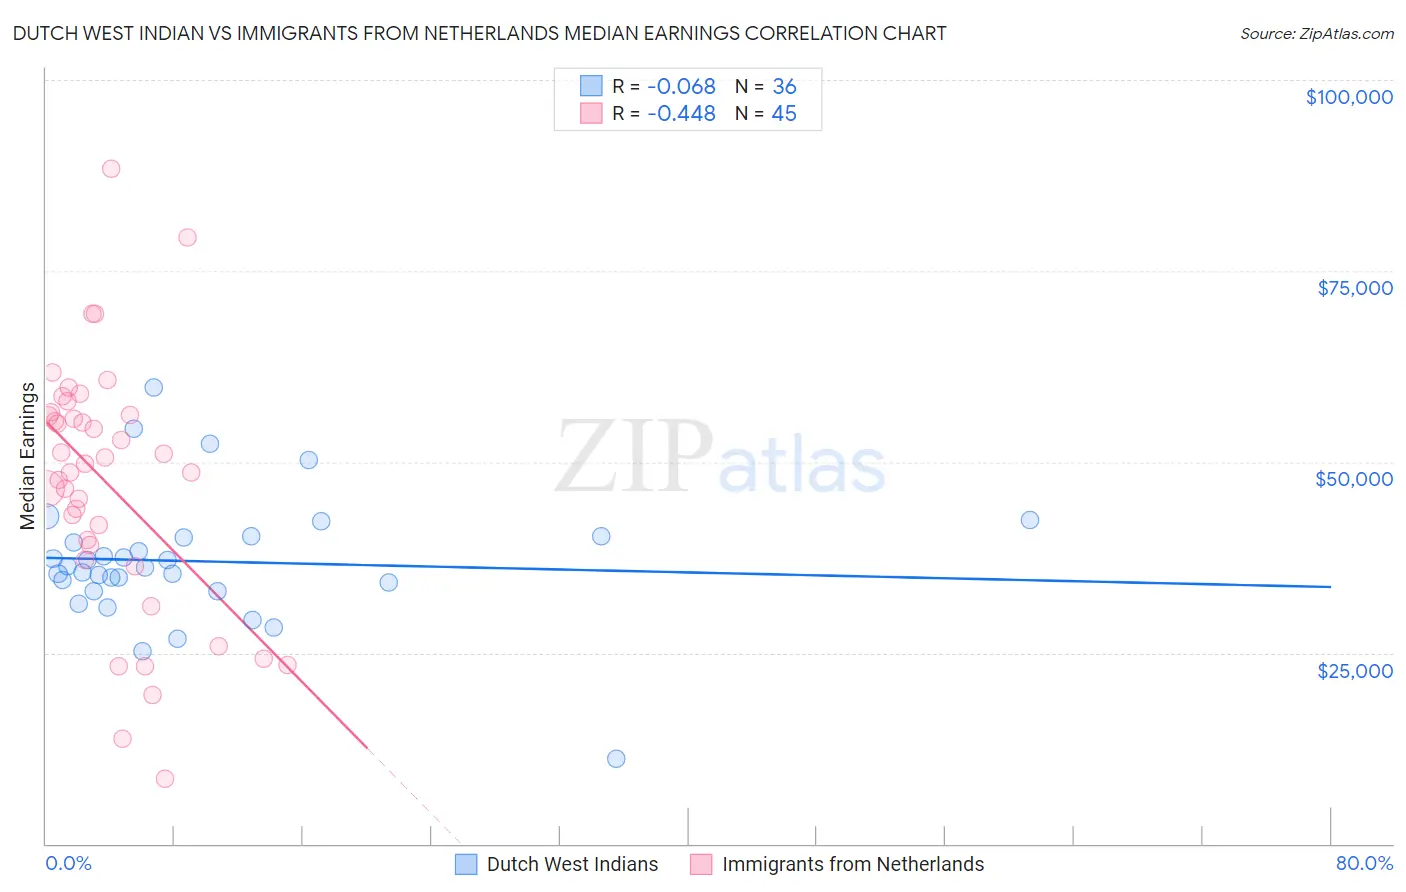
Dutch West Indian vs Immigrants from Netherlands Median Earnings Correlation Chart
The statistical analysis conducted on geographies consisting of 85,770,657 people shows a slight negative correlation between the proportion of Dutch West Indians and median earnings in the United States with a correlation coefficient (R) of -0.068 and weighted average of $40,107. Similarly, the statistical analysis conducted on geographies consisting of 237,873,103 people shows a moderate negative correlation between the proportion of Immigrants from Netherlands and median earnings in the United States with a correlation coefficient (R) of -0.448 and weighted average of $50,818, a difference of 26.7%.
Median Earnings Correlation Summary
| Measurement | Dutch West Indian | Immigrants from Netherlands |
| Minimum | $11,071 | $8,447 |
| Maximum | $59,688 | $88,336 |
| Range | $48,617 | $79,889 |
| Mean | $36,968 | $47,130 |
| Median | $36,241 | $49,796 |
| Interquartile 25% (IQ1) | $33,646 | $38,138 |
| Interquartile 75% (IQ3) | $40,145 | $56,269 |
| Interquartile Range (IQR) | $6,499 | $18,130 |
| Standard Deviation (Sample) | $8,507 | $16,545 |
| Standard Deviation (Population) | $8,388 | $16,360 |
Similar Demographics by Median Earnings
Demographics Similar to Dutch West Indians by Median Earnings
In terms of median earnings, the demographic groups most similar to Dutch West Indians are Black/African American ($40,085, a difference of 0.060%), Fijian ($40,193, a difference of 0.21%), Immigrants from Honduras ($40,195, a difference of 0.22%), Cheyenne ($40,233, a difference of 0.31%), and Seminole ($40,233, a difference of 0.31%).
| Demographics | Rating | Rank | Median Earnings |
| Hispanics or Latinos | 0.0 /100 | #311 | Tragic $40,288 |
| Chippewa | 0.0 /100 | #312 | Tragic $40,287 |
| Choctaw | 0.0 /100 | #313 | Tragic $40,270 |
| Cheyenne | 0.0 /100 | #314 | Tragic $40,233 |
| Seminole | 0.0 /100 | #315 | Tragic $40,233 |
| Immigrants | Honduras | 0.0 /100 | #316 | Tragic $40,195 |
| Fijians | 0.0 /100 | #317 | Tragic $40,193 |
| Dutch West Indians | 0.0 /100 | #318 | Tragic $40,107 |
| Blacks/African Americans | 0.0 /100 | #319 | Tragic $40,085 |
| Immigrants | Bahamas | 0.0 /100 | #320 | Tragic $39,861 |
| Mexicans | 0.0 /100 | #321 | Tragic $39,834 |
| Immigrants | Central America | 0.0 /100 | #322 | Tragic $39,762 |
| Bahamians | 0.0 /100 | #323 | Tragic $39,735 |
| Ottawa | 0.0 /100 | #324 | Tragic $39,721 |
| Creek | 0.0 /100 | #325 | Tragic $39,648 |
Demographics Similar to Immigrants from Netherlands by Median Earnings
In terms of median earnings, the demographic groups most similar to Immigrants from Netherlands are South African ($50,752, a difference of 0.13%), Immigrants from Scotland ($50,741, a difference of 0.15%), Immigrants from Egypt ($50,901, a difference of 0.16%), Immigrants from Ukraine ($50,984, a difference of 0.33%), and Lithuanian ($50,991, a difference of 0.34%).
| Demographics | Rating | Rank | Median Earnings |
| Afghans | 99.9 /100 | #66 | Exceptional $51,112 |
| Immigrants | Spain | 99.9 /100 | #67 | Exceptional $51,092 |
| Paraguayans | 99.9 /100 | #68 | Exceptional $51,068 |
| Mongolians | 99.8 /100 | #69 | Exceptional $51,038 |
| Lithuanians | 99.8 /100 | #70 | Exceptional $50,991 |
| Immigrants | Ukraine | 99.8 /100 | #71 | Exceptional $50,984 |
| Immigrants | Egypt | 99.8 /100 | #72 | Exceptional $50,901 |
| Immigrants | Netherlands | 99.8 /100 | #73 | Exceptional $50,818 |
| South Africans | 99.8 /100 | #74 | Exceptional $50,752 |
| Immigrants | Scotland | 99.8 /100 | #75 | Exceptional $50,741 |
| Immigrants | Italy | 99.7 /100 | #76 | Exceptional $50,581 |
| Immigrants | Western Europe | 99.7 /100 | #77 | Exceptional $50,549 |
| Argentineans | 99.6 /100 | #78 | Exceptional $50,399 |
| Laotians | 99.6 /100 | #79 | Exceptional $50,343 |
| Ukrainians | 99.6 /100 | #80 | Exceptional $50,320 |