Dutch vs Senegalese Median Earnings
COMPARE
Dutch
Senegalese
Median Earnings
Median Earnings Comparison
Dutch
Senegalese
$45,370
MEDIAN EARNINGS
18.4/ 100
METRIC RATING
219th/ 347
METRIC RANK
$44,373
MEDIAN EARNINGS
5.3/ 100
METRIC RATING
239th/ 347
METRIC RANK
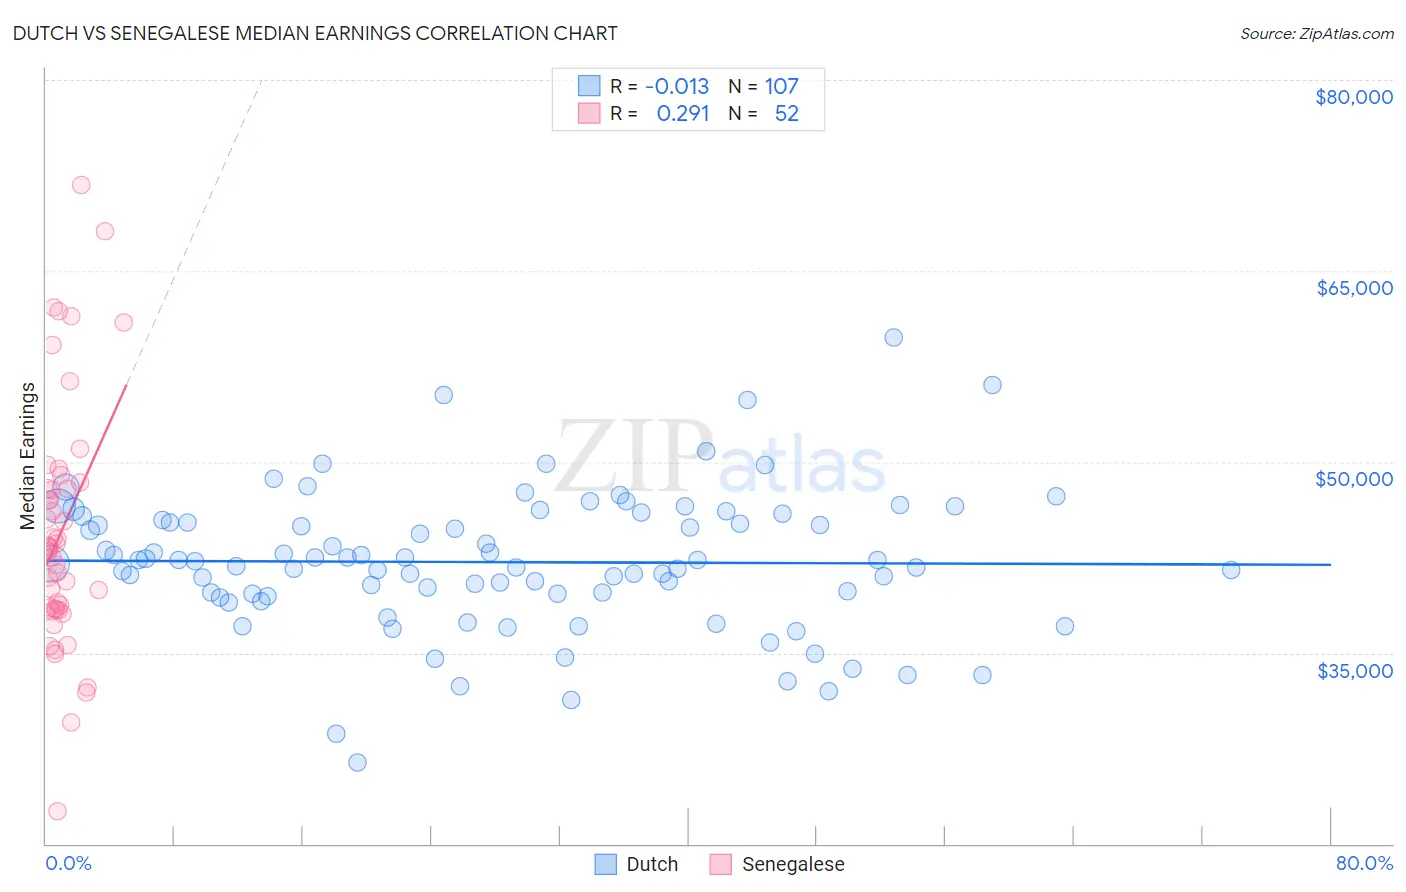
Dutch vs Senegalese Median Earnings Correlation Chart
The statistical analysis conducted on geographies consisting of 554,077,686 people shows no correlation between the proportion of Dutch and median earnings in the United States with a correlation coefficient (R) of -0.013 and weighted average of $45,370. Similarly, the statistical analysis conducted on geographies consisting of 78,107,065 people shows a weak positive correlation between the proportion of Senegalese and median earnings in the United States with a correlation coefficient (R) of 0.291 and weighted average of $44,373, a difference of 2.2%.
Median Earnings Correlation Summary
| Measurement | Dutch | Senegalese |
| Minimum | $26,401 | $22,537 |
| Maximum | $59,776 | $71,772 |
| Range | $33,374 | $49,235 |
| Mean | $42,124 | $44,574 |
| Median | $42,201 | $43,248 |
| Interquartile 25% (IQ1) | $39,612 | $38,422 |
| Interquartile 75% (IQ3) | $45,450 | $48,145 |
| Interquartile Range (IQR) | $5,838 | $9,723 |
| Standard Deviation (Sample) | $5,476 | $9,701 |
| Standard Deviation (Population) | $5,450 | $9,608 |
Demographics Similar to Dutch and Senegalese by Median Earnings
In terms of median earnings, the demographic groups most similar to Dutch are Ecuadorian ($45,214, a difference of 0.35%), Immigrants from Guyana ($45,204, a difference of 0.37%), Immigrants from Panama ($45,198, a difference of 0.38%), White/Caucasian ($45,197, a difference of 0.38%), and West Indian ($45,132, a difference of 0.53%). Similarly, the demographic groups most similar to Senegalese are Sudanese ($44,419, a difference of 0.10%), Immigrants from Ecuador ($44,462, a difference of 0.20%), British West Indian ($44,552, a difference of 0.40%), Venezuelan ($44,580, a difference of 0.47%), and Cape Verdean ($44,640, a difference of 0.60%).
| Demographics | Rating | Rank | Median Earnings |
| Dutch | 18.4 /100 | #219 | Poor $45,370 |
| Ecuadorians | 15.3 /100 | #220 | Poor $45,214 |
| Immigrants | Guyana | 15.1 /100 | #221 | Poor $45,204 |
| Immigrants | Panama | 15.0 /100 | #222 | Poor $45,198 |
| Whites/Caucasians | 15.0 /100 | #223 | Poor $45,197 |
| West Indians | 13.9 /100 | #224 | Poor $45,132 |
| Immigrants | Cambodia | 13.2 /100 | #225 | Poor $45,090 |
| Immigrants | Nigeria | 12.2 /100 | #226 | Poor $45,030 |
| Native Hawaiians | 12.2 /100 | #227 | Poor $45,027 |
| Immigrants | Iraq | 11.6 /100 | #228 | Poor $44,988 |
| Scotch-Irish | 10.7 /100 | #229 | Poor $44,924 |
| Immigrants | Western Africa | 10.3 /100 | #230 | Poor $44,893 |
| Japanese | 9.5 /100 | #231 | Tragic $44,825 |
| Delaware | 9.0 /100 | #232 | Tragic $44,783 |
| Immigrants | Sudan | 8.8 /100 | #233 | Tragic $44,767 |
| Cape Verdeans | 7.5 /100 | #234 | Tragic $44,640 |
| Venezuelans | 6.9 /100 | #235 | Tragic $44,580 |
| British West Indians | 6.7 /100 | #236 | Tragic $44,552 |
| Immigrants | Ecuador | 5.9 /100 | #237 | Tragic $44,462 |
| Sudanese | 5.6 /100 | #238 | Tragic $44,419 |
| Senegalese | 5.3 /100 | #239 | Tragic $44,373 |