Dominican vs Indonesian Median Female Earnings
COMPARE
Dominican
Indonesian
Median Female Earnings
Median Female Earnings Comparison
Dominicans
Indonesians
$37,046
MEDIAN FEMALE EARNINGS
0.4/ 100
METRIC RATING
266th/ 347
METRIC RANK
$36,140
MEDIAN FEMALE EARNINGS
0.1/ 100
METRIC RATING
284th/ 347
METRIC RANK
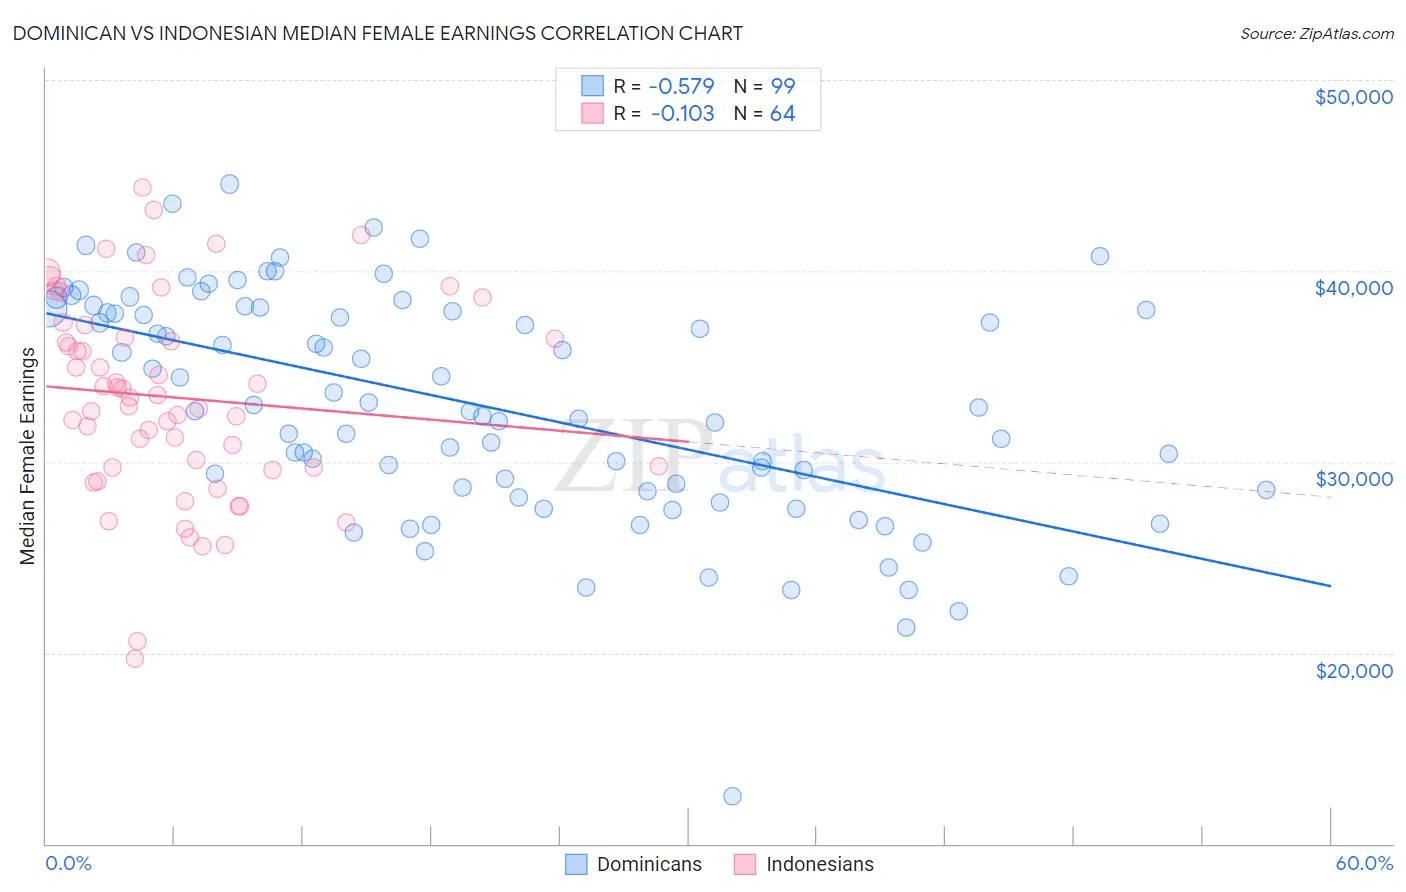
Dominican vs Indonesian Median Female Earnings Correlation Chart
The statistical analysis conducted on geographies consisting of 355,002,996 people shows a substantial negative correlation between the proportion of Dominicans and median female earnings in the United States with a correlation coefficient (R) of -0.579 and weighted average of $37,046. Similarly, the statistical analysis conducted on geographies consisting of 162,730,900 people shows a poor negative correlation between the proportion of Indonesians and median female earnings in the United States with a correlation coefficient (R) of -0.103 and weighted average of $36,140, a difference of 2.5%.
Median Female Earnings Correlation Summary
| Measurement | Dominican | Indonesian |
| Minimum | $12,455 | $19,686 |
| Maximum | $44,571 | $44,373 |
| Range | $32,116 | $24,687 |
| Mean | $32,999 | $33,375 |
| Median | $32,863 | $33,447 |
| Interquartile 25% (IQ1) | $28,508 | $29,712 |
| Interquartile 75% (IQ3) | $38,015 | $36,850 |
| Interquartile Range (IQR) | $9,507 | $7,138 |
| Standard Deviation (Sample) | $5,966 | $5,258 |
| Standard Deviation (Population) | $5,935 | $5,217 |
Demographics Similar to Dominicans and Indonesians by Median Female Earnings
In terms of median female earnings, the demographic groups most similar to Dominicans are Immigrants from Belize ($37,056, a difference of 0.030%), Nonimmigrants ($37,024, a difference of 0.060%), Cree ($37,018, a difference of 0.070%), Immigrants from Venezuela ($37,003, a difference of 0.12%), and French American Indian ($36,920, a difference of 0.34%). Similarly, the demographic groups most similar to Indonesians are Immigrants from Haiti ($36,203, a difference of 0.17%), Paiute ($36,056, a difference of 0.23%), Haitian ($36,374, a difference of 0.65%), Spanish American ($36,391, a difference of 0.69%), and Iroquois ($36,408, a difference of 0.74%).
| Demographics | Rating | Rank | Median Female Earnings |
| Immigrants | Belize | 0.4 /100 | #265 | Tragic $37,056 |
| Dominicans | 0.4 /100 | #266 | Tragic $37,046 |
| Immigrants | Nonimmigrants | 0.4 /100 | #267 | Tragic $37,024 |
| Cree | 0.4 /100 | #268 | Tragic $37,018 |
| Immigrants | Venezuela | 0.4 /100 | #269 | Tragic $37,003 |
| French American Indians | 0.3 /100 | #270 | Tragic $36,920 |
| Nicaraguans | 0.3 /100 | #271 | Tragic $36,904 |
| Immigrants | Dominican Republic | 0.3 /100 | #272 | Tragic $36,857 |
| Immigrants | Laos | 0.3 /100 | #273 | Tragic $36,841 |
| Immigrants | El Salvador | 0.2 /100 | #274 | Tragic $36,673 |
| Africans | 0.1 /100 | #275 | Tragic $36,530 |
| Central Americans | 0.1 /100 | #276 | Tragic $36,492 |
| Marshallese | 0.1 /100 | #277 | Tragic $36,459 |
| U.S. Virgin Islanders | 0.1 /100 | #278 | Tragic $36,424 |
| Immigrants | Caribbean | 0.1 /100 | #279 | Tragic $36,414 |
| Iroquois | 0.1 /100 | #280 | Tragic $36,408 |
| Spanish Americans | 0.1 /100 | #281 | Tragic $36,391 |
| Haitians | 0.1 /100 | #282 | Tragic $36,374 |
| Immigrants | Haiti | 0.1 /100 | #283 | Tragic $36,203 |
| Indonesians | 0.1 /100 | #284 | Tragic $36,140 |
| Paiute | 0.1 /100 | #285 | Tragic $36,056 |