Delaware vs Immigrants from Pakistan Householder Income Under 25 years
COMPARE
Delaware
Immigrants from Pakistan
Householder Income Under 25 years
Householder Income Under 25 years Comparison
Delaware
Immigrants from Pakistan
$47,159
HOUSEHOLDER INCOME UNDER 25 YEARS
0.0/ 100
METRIC RATING
313th/ 347
METRIC RANK
$56,789
HOUSEHOLDER INCOME UNDER 25 YEARS
100.0/ 100
METRIC RATING
25th/ 347
METRIC RANK
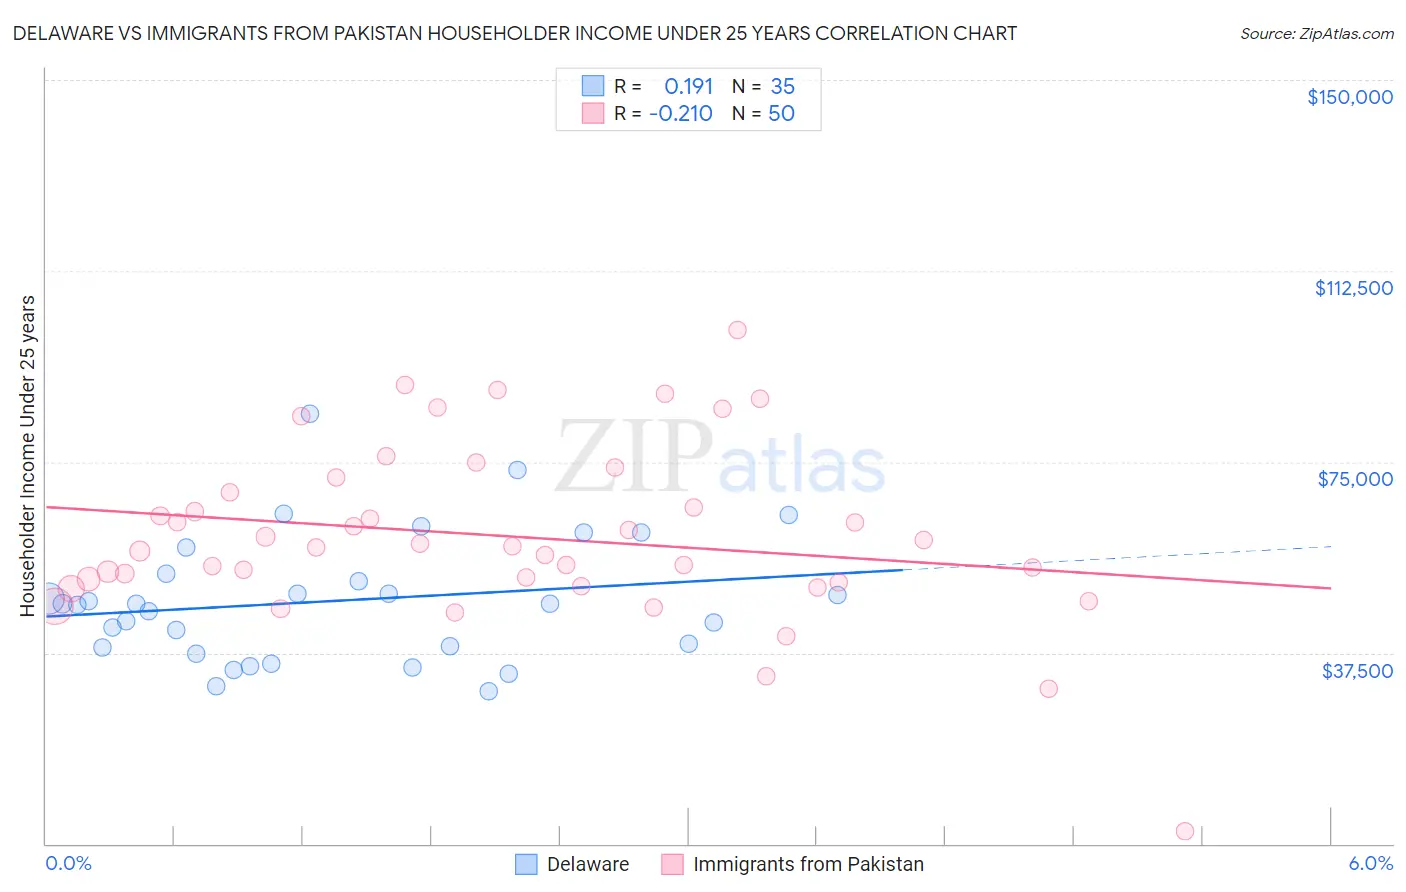
Delaware vs Immigrants from Pakistan Householder Income Under 25 years Correlation Chart
The statistical analysis conducted on geographies consisting of 88,840,483 people shows a poor positive correlation between the proportion of Delaware and household income with householder under the age of 25 in the United States with a correlation coefficient (R) of 0.191 and weighted average of $47,159. Similarly, the statistical analysis conducted on geographies consisting of 246,156,602 people shows a weak negative correlation between the proportion of Immigrants from Pakistan and household income with householder under the age of 25 in the United States with a correlation coefficient (R) of -0.210 and weighted average of $56,789, a difference of 20.4%.
Householder Income Under 25 years Correlation Summary
| Measurement | Delaware | Immigrants from Pakistan |
| Minimum | $30,000 | $2,499 |
| Maximum | $84,491 | $100,795 |
| Range | $54,491 | $98,296 |
| Mean | $47,740 | $60,406 |
| Median | $47,185 | $58,281 |
| Interquartile 25% (IQ1) | $38,611 | $51,362 |
| Interquartile 75% (IQ3) | $52,932 | $69,066 |
| Interquartile Range (IQR) | $14,321 | $17,704 |
| Standard Deviation (Sample) | $12,436 | $17,398 |
| Standard Deviation (Population) | $12,258 | $17,223 |
Similar Demographics by Householder Income Under 25 years
Demographics Similar to Delaware by Householder Income Under 25 years
In terms of householder income under 25 years, the demographic groups most similar to Delaware are Chippewa ($47,015, a difference of 0.31%), Crow ($47,012, a difference of 0.31%), Sudanese ($46,982, a difference of 0.38%), Hopi ($46,978, a difference of 0.39%), and Bermudan ($47,359, a difference of 0.43%).
| Demographics | Rating | Rank | Householder Income Under 25 years |
| Natives/Alaskans | 0.0 /100 | #306 | Tragic $47,704 |
| Bangladeshis | 0.0 /100 | #307 | Tragic $47,589 |
| Comanche | 0.0 /100 | #308 | Tragic $47,518 |
| U.S. Virgin Islanders | 0.0 /100 | #309 | Tragic $47,448 |
| Iroquois | 0.0 /100 | #310 | Tragic $47,380 |
| Ottawa | 0.0 /100 | #311 | Tragic $47,366 |
| Bermudans | 0.0 /100 | #312 | Tragic $47,359 |
| Delaware | 0.0 /100 | #313 | Tragic $47,159 |
| Chippewa | 0.0 /100 | #314 | Tragic $47,015 |
| Crow | 0.0 /100 | #315 | Tragic $47,012 |
| Sudanese | 0.0 /100 | #316 | Tragic $46,982 |
| Hopi | 0.0 /100 | #317 | Tragic $46,978 |
| Spanish Americans | 0.0 /100 | #318 | Tragic $46,913 |
| Africans | 0.0 /100 | #319 | Tragic $46,838 |
| Immigrants | Sudan | 0.0 /100 | #320 | Tragic $46,791 |
Demographics Similar to Immigrants from Pakistan by Householder Income Under 25 years
In terms of householder income under 25 years, the demographic groups most similar to Immigrants from Pakistan are Immigrants from Singapore ($56,835, a difference of 0.080%), Immigrants from Australia ($56,660, a difference of 0.23%), Tongan ($56,972, a difference of 0.32%), Asian ($57,003, a difference of 0.38%), and Immigrants from Ireland ($57,075, a difference of 0.50%).
| Demographics | Rating | Rank | Householder Income Under 25 years |
| Immigrants | Eastern Asia | 100.0 /100 | #18 | Exceptional $57,123 |
| Bhutanese | 100.0 /100 | #19 | Exceptional $57,078 |
| Immigrants | Ireland | 100.0 /100 | #20 | Exceptional $57,075 |
| Immigrants | Fiji | 100.0 /100 | #21 | Exceptional $57,074 |
| Asians | 100.0 /100 | #22 | Exceptional $57,003 |
| Tongans | 100.0 /100 | #23 | Exceptional $56,972 |
| Immigrants | Singapore | 100.0 /100 | #24 | Exceptional $56,835 |
| Immigrants | Pakistan | 100.0 /100 | #25 | Exceptional $56,789 |
| Immigrants | Australia | 100.0 /100 | #26 | Exceptional $56,660 |
| Immigrants | North Macedonia | 100.0 /100 | #27 | Exceptional $56,503 |
| Immigrants | Peru | 100.0 /100 | #28 | Exceptional $56,384 |
| Immigrants | Asia | 100.0 /100 | #29 | Exceptional $56,379 |
| Immigrants | Moldova | 100.0 /100 | #30 | Exceptional $56,168 |
| Vietnamese | 100.0 /100 | #31 | Exceptional $56,127 |
| Peruvians | 100.0 /100 | #32 | Exceptional $56,052 |