Danish vs Panamanian Householder Income Ages 25 - 44 years
COMPARE
Danish
Panamanian
Householder Income Ages 25 - 44 years
Householder Income Ages 25 - 44 years Comparison
Danes
Panamanians
$97,221
HOUSEHOLDER INCOME AGES 25 - 44 YEARS
81.3/ 100
METRIC RATING
142nd/ 347
METRIC RANK
$90,193
HOUSEHOLDER INCOME AGES 25 - 44 YEARS
8.1/ 100
METRIC RATING
215th/ 347
METRIC RANK
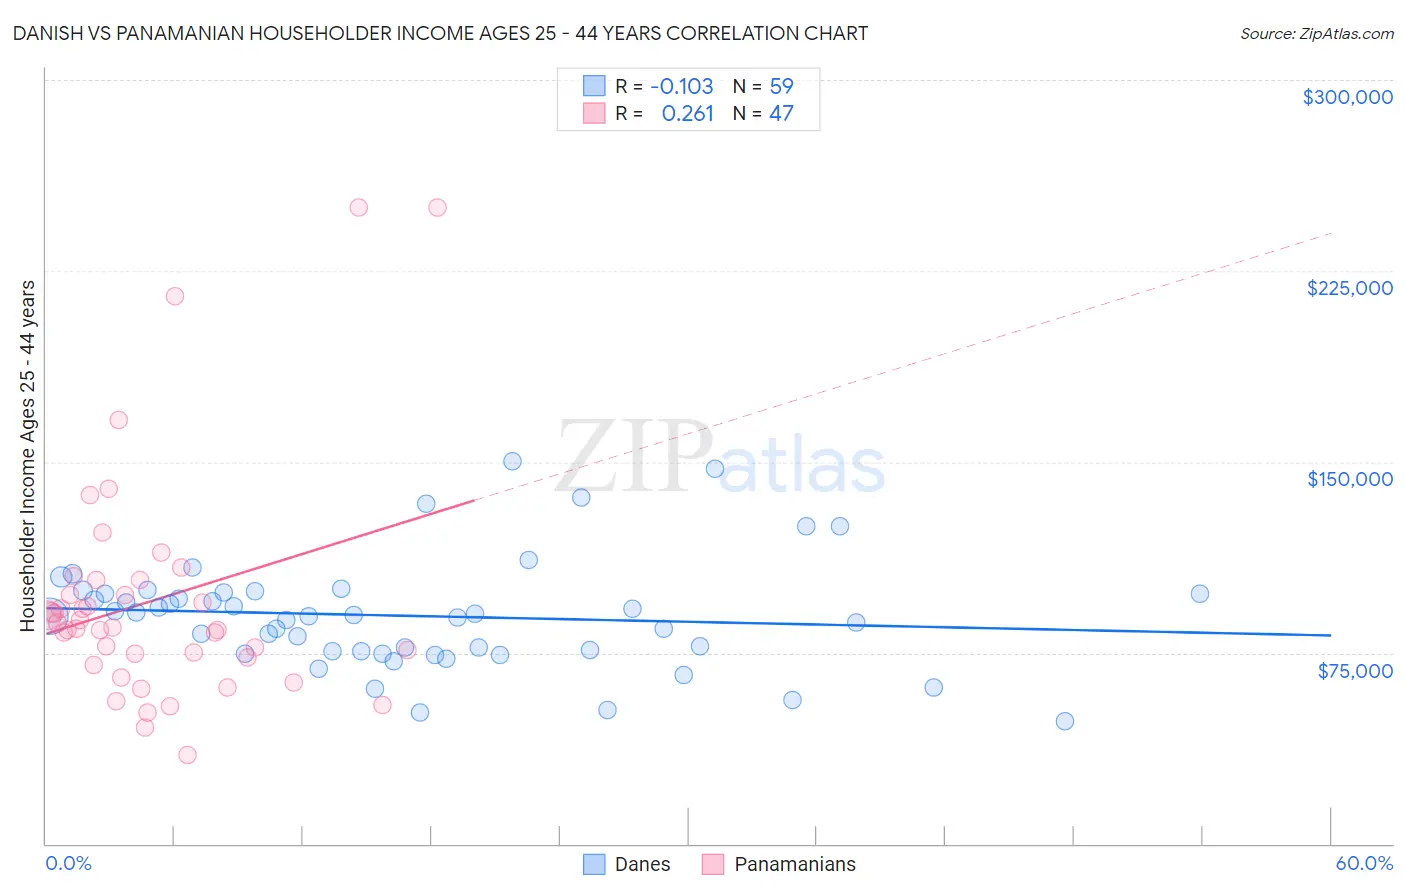
Danish vs Panamanian Householder Income Ages 25 - 44 years Correlation Chart
The statistical analysis conducted on geographies consisting of 471,956,523 people shows a poor negative correlation between the proportion of Danes and household income with householder between the ages 25 and 44 in the United States with a correlation coefficient (R) of -0.103 and weighted average of $97,221. Similarly, the statistical analysis conducted on geographies consisting of 280,855,443 people shows a weak positive correlation between the proportion of Panamanians and household income with householder between the ages 25 and 44 in the United States with a correlation coefficient (R) of 0.261 and weighted average of $90,193, a difference of 7.8%.
Householder Income Ages 25 - 44 years Correlation Summary
| Measurement | Danish | Panamanian |
| Minimum | $48,125 | $34,890 |
| Maximum | $150,222 | $250,001 |
| Range | $102,097 | $215,111 |
| Mean | $89,539 | $95,499 |
| Median | $89,288 | $85,019 |
| Interquartile 25% (IQ1) | $75,783 | $72,969 |
| Interquartile 75% (IQ3) | $98,883 | $103,669 |
| Interquartile Range (IQR) | $23,100 | $30,700 |
| Standard Deviation (Sample) | $21,492 | $45,169 |
| Standard Deviation (Population) | $21,309 | $44,686 |
Similar Demographics by Householder Income Ages 25 - 44 years
Demographics Similar to Danes by Householder Income Ages 25 - 44 years
In terms of householder income ages 25 - 44 years, the demographic groups most similar to Danes are Luxembourger ($97,237, a difference of 0.020%), Immigrants from Jordan ($97,185, a difference of 0.040%), Immigrants from Chile ($97,159, a difference of 0.060%), Immigrants from Morocco ($97,305, a difference of 0.090%), and Immigrants from Peru ($97,329, a difference of 0.11%).
| Demographics | Rating | Rank | Householder Income Ages 25 - 44 years |
| Immigrants | Oceania | 84.5 /100 | #135 | Excellent $97,623 |
| Hungarians | 83.9 /100 | #136 | Excellent $97,544 |
| Lebanese | 82.3 /100 | #137 | Excellent $97,339 |
| Arabs | 82.3 /100 | #138 | Excellent $97,336 |
| Immigrants | Peru | 82.2 /100 | #139 | Excellent $97,329 |
| Immigrants | Morocco | 82.0 /100 | #140 | Excellent $97,305 |
| Luxembourgers | 81.5 /100 | #141 | Excellent $97,237 |
| Danes | 81.3 /100 | #142 | Excellent $97,221 |
| Immigrants | Jordan | 81.0 /100 | #143 | Excellent $97,185 |
| Immigrants | Chile | 80.8 /100 | #144 | Excellent $97,159 |
| Norwegians | 78.2 /100 | #145 | Good $96,866 |
| Ethiopians | 77.8 /100 | #146 | Good $96,824 |
| Immigrants | Syria | 77.4 /100 | #147 | Good $96,789 |
| Irish | 76.9 /100 | #148 | Good $96,730 |
| Basques | 76.6 /100 | #149 | Good $96,709 |
Demographics Similar to Panamanians by Householder Income Ages 25 - 44 years
In terms of householder income ages 25 - 44 years, the demographic groups most similar to Panamanians are Ghanaian ($90,137, a difference of 0.060%), Immigrants from Africa ($90,372, a difference of 0.20%), Scotch-Irish ($89,969, a difference of 0.25%), Immigrants from Bangladesh ($90,448, a difference of 0.28%), and Guyanese ($89,940, a difference of 0.28%).
| Demographics | Rating | Rank | Householder Income Ages 25 - 44 years |
| Immigrants | Thailand | 14.3 /100 | #208 | Poor $91,337 |
| Immigrants | Uruguay | 13.2 /100 | #209 | Poor $91,171 |
| Immigrants | Kenya | 10.9 /100 | #210 | Poor $90,767 |
| Iraqis | 10.8 /100 | #211 | Poor $90,764 |
| Hawaiians | 10.6 /100 | #212 | Poor $90,722 |
| Immigrants | Bangladesh | 9.3 /100 | #213 | Tragic $90,448 |
| Immigrants | Africa | 8.9 /100 | #214 | Tragic $90,372 |
| Panamanians | 8.1 /100 | #215 | Tragic $90,193 |
| Ghanaians | 7.9 /100 | #216 | Tragic $90,137 |
| Scotch-Irish | 7.3 /100 | #217 | Tragic $89,969 |
| Guyanese | 7.1 /100 | #218 | Tragic $89,940 |
| Delaware | 6.9 /100 | #219 | Tragic $89,876 |
| Trinidadians and Tobagonians | 6.8 /100 | #220 | Tragic $89,856 |
| Immigrants | Trinidad and Tobago | 6.5 /100 | #221 | Tragic $89,748 |
| Immigrants | Ecuador | 6.2 /100 | #222 | Tragic $89,673 |