Danish vs Immigrants from Senegal Median Household Income
COMPARE
Danish
Immigrants from Senegal
Median Household Income
Median Household Income Comparison
Danes
Immigrants from Senegal
$87,676
MEDIAN HOUSEHOLD INCOME
83.9/ 100
METRIC RATING
143rd/ 347
METRIC RANK
$76,915
MEDIAN HOUSEHOLD INCOME
0.5/ 100
METRIC RATING
257th/ 347
METRIC RANK
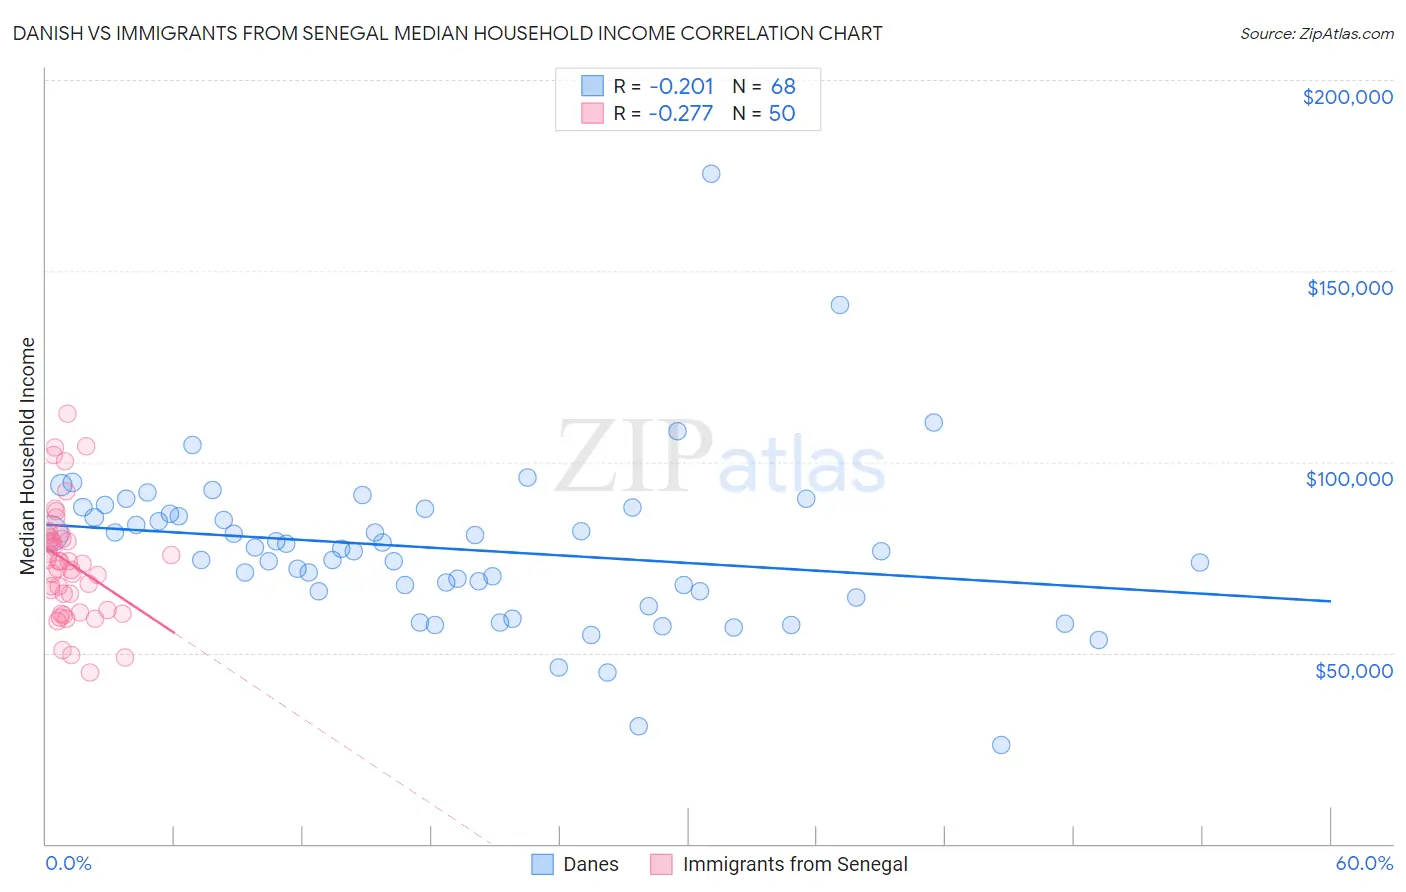
Danish vs Immigrants from Senegal Median Household Income Correlation Chart
The statistical analysis conducted on geographies consisting of 473,742,440 people shows a weak negative correlation between the proportion of Danes and median household income in the United States with a correlation coefficient (R) of -0.201 and weighted average of $87,676. Similarly, the statistical analysis conducted on geographies consisting of 90,107,777 people shows a weak negative correlation between the proportion of Immigrants from Senegal and median household income in the United States with a correlation coefficient (R) of -0.277 and weighted average of $76,915, a difference of 14.0%.
Median Household Income Correlation Summary
| Measurement | Danish | Immigrants from Senegal |
| Minimum | $25,809 | $44,770 |
| Maximum | $175,595 | $112,479 |
| Range | $149,786 | $67,709 |
| Mean | $77,182 | $73,616 |
| Median | $76,890 | $73,578 |
| Interquartile 25% (IQ1) | $66,124 | $61,261 |
| Interquartile 75% (IQ3) | $87,030 | $80,057 |
| Interquartile Range (IQR) | $20,907 | $18,796 |
| Standard Deviation (Sample) | $21,727 | $14,821 |
| Standard Deviation (Population) | $21,566 | $14,672 |
Similar Demographics by Median Household Income
Demographics Similar to Danes by Median Household Income
In terms of median household income, the demographic groups most similar to Danes are Canadian ($87,769, a difference of 0.11%), Serbian ($87,572, a difference of 0.12%), Ugandan ($87,557, a difference of 0.14%), Immigrants from Uganda ($87,553, a difference of 0.14%), and South American Indian ($87,446, a difference of 0.26%).
| Demographics | Rating | Rank | Median Household Income |
| Poles | 89.7 /100 | #136 | Excellent $88,472 |
| Sierra Leoneans | 89.6 /100 | #137 | Excellent $88,463 |
| Arabs | 89.2 /100 | #138 | Excellent $88,398 |
| Immigrants | Chile | 89.2 /100 | #139 | Excellent $88,388 |
| Lebanese | 87.2 /100 | #140 | Excellent $88,091 |
| Immigrants | Morocco | 86.0 /100 | #141 | Excellent $87,930 |
| Canadians | 84.7 /100 | #142 | Excellent $87,769 |
| Danes | 83.9 /100 | #143 | Excellent $87,676 |
| Serbians | 83.0 /100 | #144 | Excellent $87,572 |
| Ugandans | 82.9 /100 | #145 | Excellent $87,557 |
| Immigrants | Uganda | 82.8 /100 | #146 | Excellent $87,553 |
| South American Indians | 81.8 /100 | #147 | Excellent $87,446 |
| Costa Ricans | 80.0 /100 | #148 | Excellent $87,262 |
| Immigrants | Nepal | 77.7 /100 | #149 | Good $87,046 |
| Basques | 77.2 /100 | #150 | Good $87,001 |
Demographics Similar to Immigrants from Senegal by Median Household Income
In terms of median household income, the demographic groups most similar to Immigrants from Senegal are Belizean ($77,028, a difference of 0.15%), Immigrants from Nicaragua ($76,784, a difference of 0.17%), Spanish American Indian ($76,670, a difference of 0.32%), Jamaican ($76,583, a difference of 0.43%), and Immigrants from Grenada ($76,517, a difference of 0.52%).
| Demographics | Rating | Rank | Median Household Income |
| Immigrants | Laos | 1.3 /100 | #250 | Tragic $78,327 |
| Mexican American Indians | 1.2 /100 | #251 | Tragic $78,166 |
| Immigrants | West Indies | 1.0 /100 | #252 | Tragic $77,956 |
| Immigrants | St. Vincent and the Grenadines | 0.9 /100 | #253 | Tragic $77,690 |
| Sub-Saharan Africans | 0.8 /100 | #254 | Tragic $77,631 |
| Immigrants | Middle Africa | 0.8 /100 | #255 | Tragic $77,559 |
| Belizeans | 0.6 /100 | #256 | Tragic $77,028 |
| Immigrants | Senegal | 0.5 /100 | #257 | Tragic $76,915 |
| Immigrants | Nicaragua | 0.5 /100 | #258 | Tragic $76,784 |
| Spanish American Indians | 0.4 /100 | #259 | Tragic $76,670 |
| Jamaicans | 0.4 /100 | #260 | Tragic $76,583 |
| Immigrants | Grenada | 0.4 /100 | #261 | Tragic $76,517 |
| French American Indians | 0.4 /100 | #262 | Tragic $76,387 |
| Alaskan Athabascans | 0.4 /100 | #263 | Tragic $76,383 |
| Guatemalans | 0.3 /100 | #264 | Tragic $75,961 |