Danish vs Immigrants from Iran Median Family Income
COMPARE
Danish
Immigrants from Iran
Median Family Income
Median Family Income Comparison
Danes
Immigrants from Iran
$105,900
MEDIAN FAMILY INCOME
83.8/ 100
METRIC RATING
145th/ 347
METRIC RANK
$130,894
MEDIAN FAMILY INCOME
100.0/ 100
METRIC RATING
8th/ 347
METRIC RANK
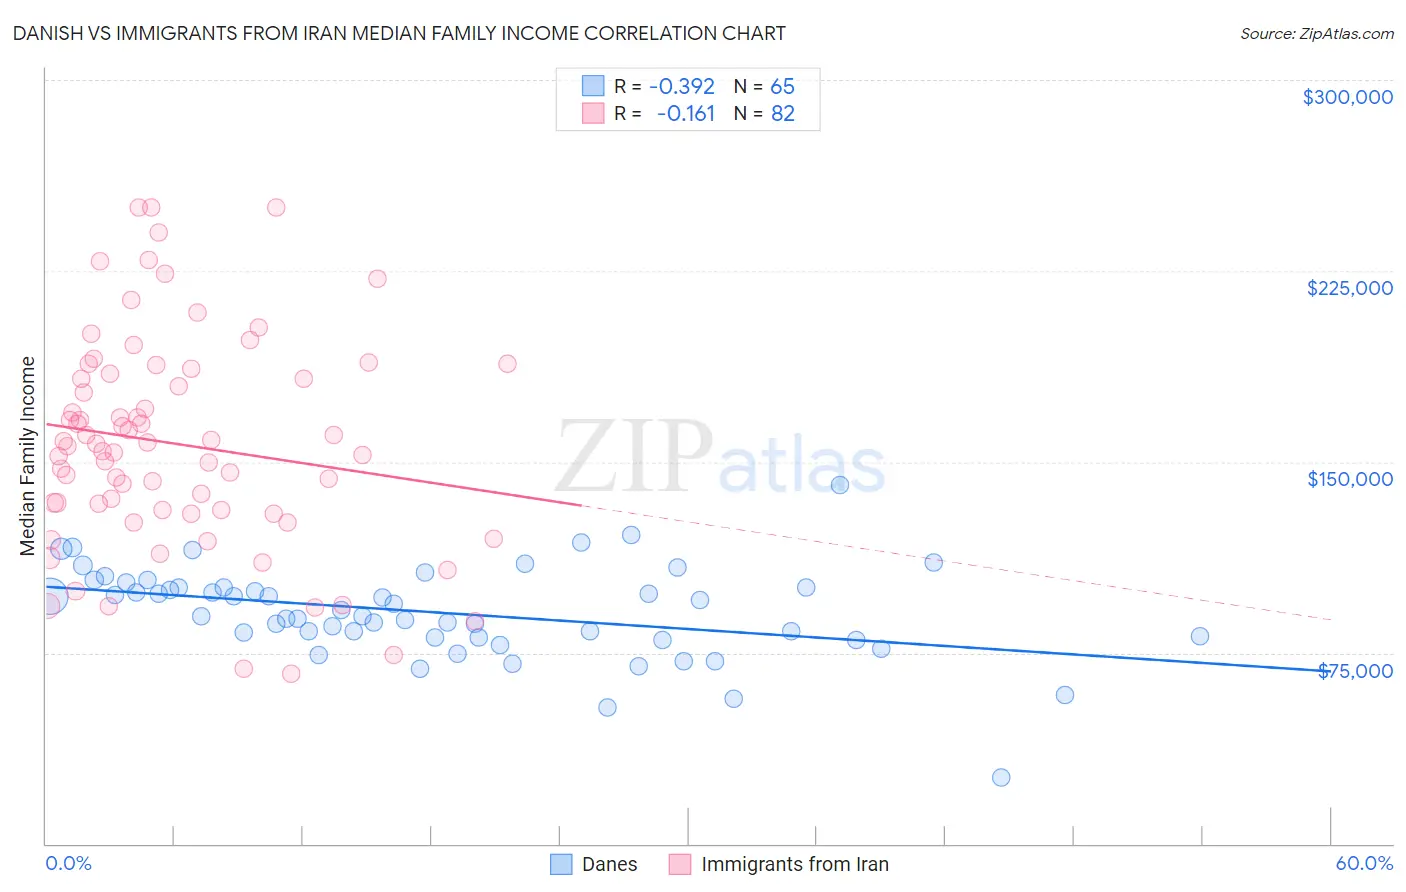
Danish vs Immigrants from Iran Median Family Income Correlation Chart
The statistical analysis conducted on geographies consisting of 473,651,009 people shows a mild negative correlation between the proportion of Danes and median family income in the United States with a correlation coefficient (R) of -0.392 and weighted average of $105,900. Similarly, the statistical analysis conducted on geographies consisting of 279,798,585 people shows a poor negative correlation between the proportion of Immigrants from Iran and median family income in the United States with a correlation coefficient (R) of -0.161 and weighted average of $130,894, a difference of 23.6%.
Median Family Income Correlation Summary
| Measurement | Danish | Immigrants from Iran |
| Minimum | $25,809 | $66,897 |
| Maximum | $140,986 | $250,001 |
| Range | $115,177 | $183,104 |
| Mean | $90,730 | $156,930 |
| Median | $89,508 | $156,641 |
| Interquartile 25% (IQ1) | $81,126 | $131,095 |
| Interquartile 75% (IQ3) | $100,729 | $184,731 |
| Interquartile Range (IQR) | $19,603 | $53,637 |
| Standard Deviation (Sample) | $18,118 | $42,072 |
| Standard Deviation (Population) | $17,979 | $41,815 |
Similar Demographics by Median Family Income
Demographics Similar to Danes by Median Family Income
In terms of median family income, the demographic groups most similar to Danes are Tongan ($105,967, a difference of 0.060%), Immigrants from Morocco ($105,964, a difference of 0.060%), Czech ($105,839, a difference of 0.060%), Slovene ($106,020, a difference of 0.11%), and Immigrants from Syria ($106,118, a difference of 0.21%).
| Demographics | Rating | Rank | Median Family Income |
| Immigrants | Vietnam | 85.7 /100 | #138 | Excellent $106,186 |
| Luxembourgers | 85.7 /100 | #139 | Excellent $106,183 |
| Norwegians | 85.5 /100 | #140 | Excellent $106,144 |
| Immigrants | Syria | 85.3 /100 | #141 | Excellent $106,118 |
| Slovenes | 84.7 /100 | #142 | Excellent $106,020 |
| Tongans | 84.3 /100 | #143 | Excellent $105,967 |
| Immigrants | Morocco | 84.3 /100 | #144 | Excellent $105,964 |
| Danes | 83.8 /100 | #145 | Excellent $105,900 |
| Czechs | 83.4 /100 | #146 | Excellent $105,839 |
| Immigrants | Chile | 82.1 /100 | #147 | Excellent $105,655 |
| Hungarians | 81.7 /100 | #148 | Excellent $105,609 |
| Immigrants | Germany | 80.9 /100 | #149 | Excellent $105,507 |
| Irish | 80.5 /100 | #150 | Excellent $105,453 |
| Peruvians | 80.4 /100 | #151 | Excellent $105,444 |
| Immigrants | Albania | 79.1 /100 | #152 | Good $105,285 |
Demographics Similar to Immigrants from Iran by Median Family Income
In terms of median family income, the demographic groups most similar to Immigrants from Iran are Immigrants from Hong Kong ($131,067, a difference of 0.13%), Thai ($131,281, a difference of 0.30%), Okinawan ($129,979, a difference of 0.70%), Iranian ($133,839, a difference of 2.2%), and Immigrants from India ($134,028, a difference of 2.4%).
| Demographics | Rating | Rank | Median Family Income |
| Filipinos | 100.0 /100 | #1 | Exceptional $138,397 |
| Immigrants | Taiwan | 100.0 /100 | #2 | Exceptional $136,949 |
| Immigrants | Singapore | 100.0 /100 | #3 | Exceptional $134,818 |
| Immigrants | India | 100.0 /100 | #4 | Exceptional $134,028 |
| Iranians | 100.0 /100 | #5 | Exceptional $133,839 |
| Thais | 100.0 /100 | #6 | Exceptional $131,281 |
| Immigrants | Hong Kong | 100.0 /100 | #7 | Exceptional $131,067 |
| Immigrants | Iran | 100.0 /100 | #8 | Exceptional $130,894 |
| Okinawans | 100.0 /100 | #9 | Exceptional $129,979 |
| Immigrants | Ireland | 100.0 /100 | #10 | Exceptional $127,584 |
| Immigrants | Israel | 100.0 /100 | #11 | Exceptional $127,430 |
| Cypriots | 100.0 /100 | #12 | Exceptional $127,064 |
| Immigrants | Australia | 100.0 /100 | #13 | Exceptional $126,620 |
| Immigrants | South Central Asia | 100.0 /100 | #14 | Exceptional $125,956 |
| Eastern Europeans | 100.0 /100 | #15 | Exceptional $125,546 |