Danish vs Cajun Median Earnings
COMPARE
Danish
Cajun
Median Earnings
Median Earnings Comparison
Danes
Cajuns
$46,392
MEDIAN EARNINGS
48.6/ 100
METRIC RATING
176th/ 347
METRIC RANK
$42,189
MEDIAN EARNINGS
0.3/ 100
METRIC RATING
278th/ 347
METRIC RANK
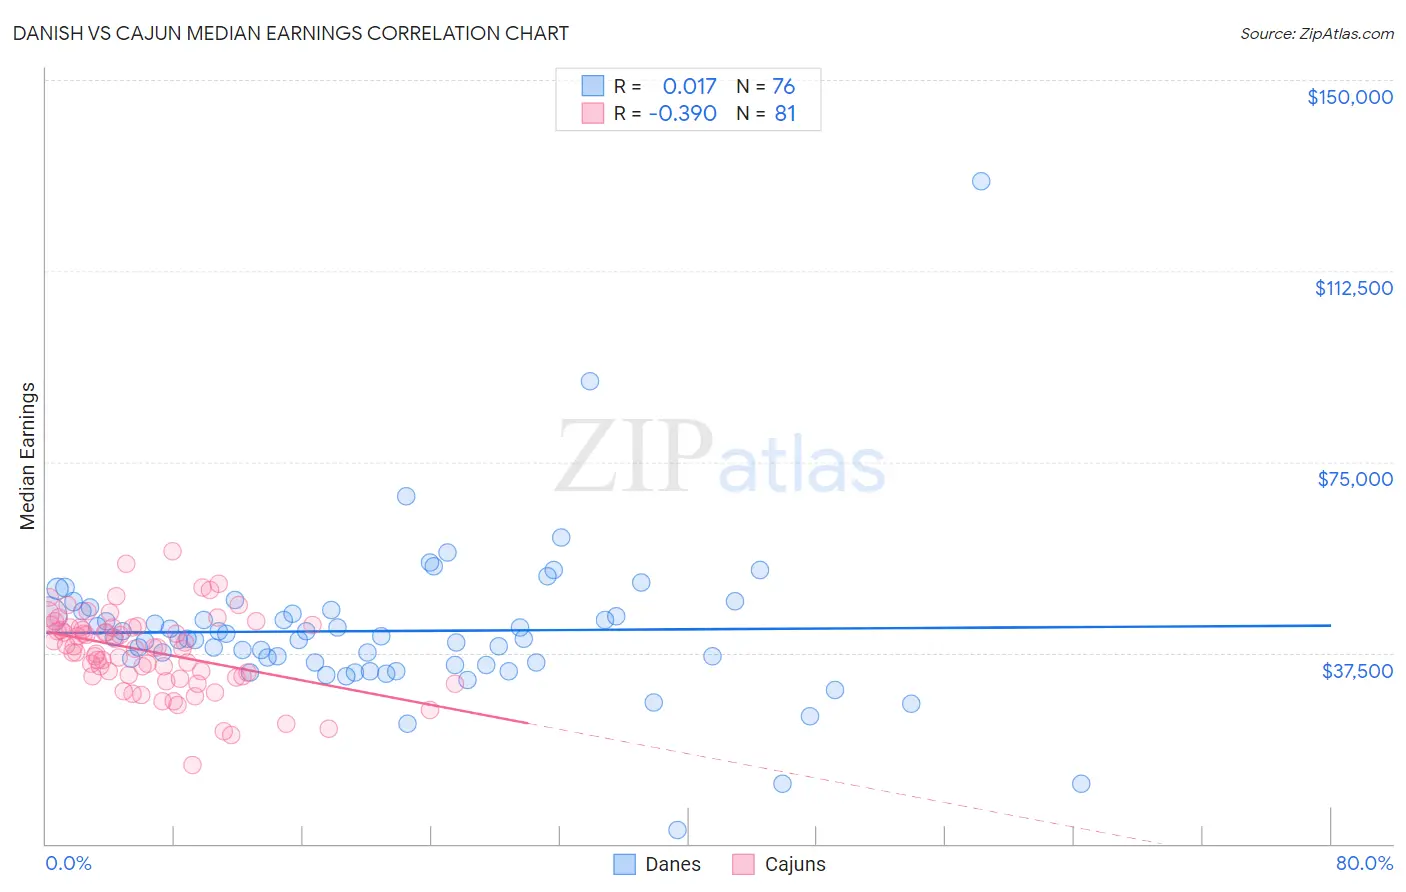
Danish vs Cajun Median Earnings Correlation Chart
The statistical analysis conducted on geographies consisting of 474,068,327 people shows no correlation between the proportion of Danes and median earnings in the United States with a correlation coefficient (R) of 0.017 and weighted average of $46,392. Similarly, the statistical analysis conducted on geographies consisting of 149,692,940 people shows a mild negative correlation between the proportion of Cajuns and median earnings in the United States with a correlation coefficient (R) of -0.390 and weighted average of $42,189, a difference of 10.0%.
Median Earnings Correlation Summary
| Measurement | Danish | Cajun |
| Minimum | $2,766 | $15,451 |
| Maximum | $130,117 | $57,514 |
| Range | $127,351 | $42,063 |
| Mean | $41,795 | $37,817 |
| Median | $40,260 | $38,499 |
| Interquartile 25% (IQ1) | $35,372 | $32,952 |
| Interquartile 75% (IQ3) | $45,489 | $42,585 |
| Interquartile Range (IQR) | $10,117 | $9,633 |
| Standard Deviation (Sample) | $15,565 | $7,734 |
| Standard Deviation (Population) | $15,462 | $7,686 |
Similar Demographics by Median Earnings
Demographics Similar to Danes by Median Earnings
In terms of median earnings, the demographic groups most similar to Danes are Basque ($46,399, a difference of 0.020%), Belgian ($46,375, a difference of 0.040%), Scandinavian ($46,433, a difference of 0.090%), Colombian ($46,349, a difference of 0.090%), and Ghanaian ($46,440, a difference of 0.10%).
| Demographics | Rating | Rank | Median Earnings |
| Immigrants | South America | 54.0 /100 | #169 | Average $46,548 |
| Immigrants | Immigrants | 51.6 /100 | #170 | Average $46,478 |
| Scottish | 51.1 /100 | #171 | Average $46,463 |
| Kenyans | 51.0 /100 | #172 | Average $46,462 |
| Ghanaians | 50.3 /100 | #173 | Average $46,440 |
| Scandinavians | 50.0 /100 | #174 | Average $46,433 |
| Basques | 48.8 /100 | #175 | Average $46,399 |
| Danes | 48.6 /100 | #176 | Average $46,392 |
| Belgians | 48.0 /100 | #177 | Average $46,375 |
| Colombians | 47.1 /100 | #178 | Average $46,349 |
| English | 46.5 /100 | #179 | Average $46,334 |
| Puget Sound Salish | 46.5 /100 | #180 | Average $46,333 |
| Immigrants | Cameroon | 46.4 /100 | #181 | Average $46,329 |
| Swiss | 45.9 /100 | #182 | Average $46,315 |
| French | 45.2 /100 | #183 | Average $46,296 |
Demographics Similar to Cajuns by Median Earnings
In terms of median earnings, the demographic groups most similar to Cajuns are Colville ($42,151, a difference of 0.090%), Hmong ($42,111, a difference of 0.19%), Central American ($42,280, a difference of 0.21%), Spanish American ($42,316, a difference of 0.30%), and Immigrants from Belize ($42,339, a difference of 0.36%).
| Demographics | Rating | Rank | Median Earnings |
| Pennsylvania Germans | 0.5 /100 | #271 | Tragic $42,615 |
| Iroquois | 0.4 /100 | #272 | Tragic $42,430 |
| Immigrants | Dominica | 0.4 /100 | #273 | Tragic $42,420 |
| Immigrants | El Salvador | 0.4 /100 | #274 | Tragic $42,413 |
| Immigrants | Belize | 0.3 /100 | #275 | Tragic $42,339 |
| Spanish Americans | 0.3 /100 | #276 | Tragic $42,316 |
| Central Americans | 0.3 /100 | #277 | Tragic $42,280 |
| Cajuns | 0.3 /100 | #278 | Tragic $42,189 |
| Colville | 0.2 /100 | #279 | Tragic $42,151 |
| Hmong | 0.2 /100 | #280 | Tragic $42,111 |
| Marshallese | 0.2 /100 | #281 | Tragic $41,969 |
| Africans | 0.2 /100 | #282 | Tragic $41,955 |
| Dominicans | 0.2 /100 | #283 | Tragic $41,864 |
| Blackfeet | 0.2 /100 | #284 | Tragic $41,822 |
| Immigrants | Nicaragua | 0.1 /100 | #285 | Tragic $41,737 |