Cuban vs Immigrants from Portugal Median Household Income
COMPARE
Cuban
Immigrants from Portugal
Median Household Income
Median Household Income Comparison
Cubans
Immigrants from Portugal
$73,392
MEDIAN HOUSEHOLD INCOME
0.1/ 100
METRIC RATING
295th/ 347
METRIC RANK
$84,740
MEDIAN HOUSEHOLD INCOME
44.2/ 100
METRIC RATING
180th/ 347
METRIC RANK
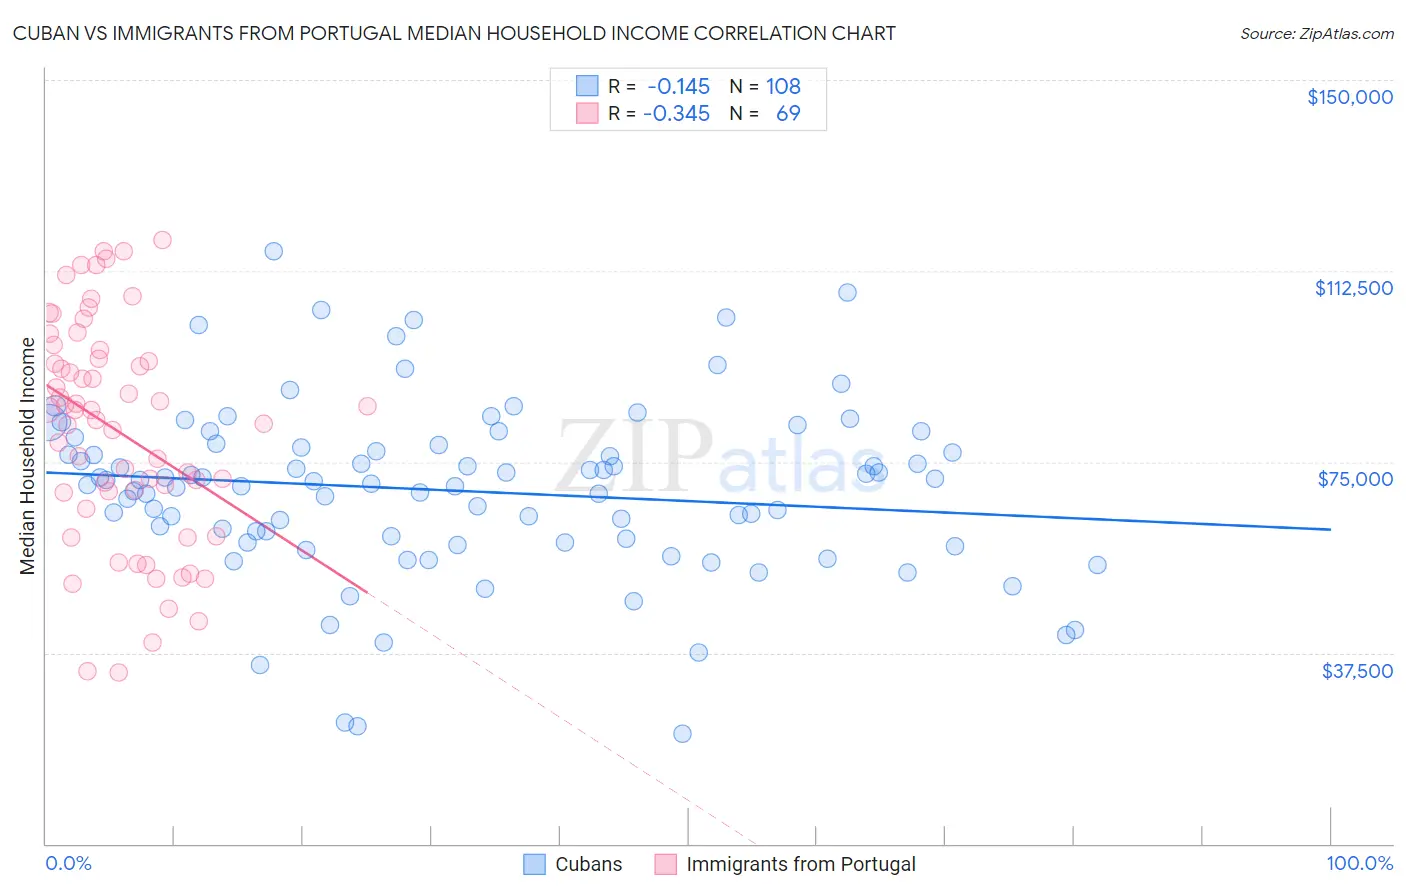
Cuban vs Immigrants from Portugal Median Household Income Correlation Chart
The statistical analysis conducted on geographies consisting of 448,852,866 people shows a poor negative correlation between the proportion of Cubans and median household income in the United States with a correlation coefficient (R) of -0.145 and weighted average of $73,392. Similarly, the statistical analysis conducted on geographies consisting of 174,758,543 people shows a mild negative correlation between the proportion of Immigrants from Portugal and median household income in the United States with a correlation coefficient (R) of -0.345 and weighted average of $84,740, a difference of 15.5%.
Median Household Income Correlation Summary
| Measurement | Cuban | Immigrants from Portugal |
| Minimum | $21,567 | $33,750 |
| Maximum | $116,431 | $118,667 |
| Range | $94,864 | $84,917 |
| Mean | $69,339 | $80,926 |
| Median | $70,955 | $85,116 |
| Interquartile 25% (IQ1) | $59,587 | $67,289 |
| Interquartile 75% (IQ3) | $78,118 | $96,142 |
| Interquartile Range (IQR) | $18,531 | $28,853 |
| Standard Deviation (Sample) | $17,087 | $21,750 |
| Standard Deviation (Population) | $17,007 | $21,592 |
Similar Demographics by Median Household Income
Demographics Similar to Cubans by Median Household Income
In terms of median household income, the demographic groups most similar to Cubans are Haitian ($73,306, a difference of 0.12%), Blackfeet ($73,509, a difference of 0.16%), Immigrants from Cabo Verde ($73,515, a difference of 0.17%), Immigrants from Mexico ($73,160, a difference of 0.32%), and Comanche ($73,747, a difference of 0.48%).
| Demographics | Rating | Rank | Median Household Income |
| Immigrants | Central America | 0.1 /100 | #288 | Tragic $74,217 |
| Fijians | 0.1 /100 | #289 | Tragic $74,205 |
| Bangladeshis | 0.1 /100 | #290 | Tragic $74,112 |
| Hispanics or Latinos | 0.1 /100 | #291 | Tragic $73,823 |
| Comanche | 0.1 /100 | #292 | Tragic $73,747 |
| Immigrants | Cabo Verde | 0.1 /100 | #293 | Tragic $73,515 |
| Blackfeet | 0.1 /100 | #294 | Tragic $73,509 |
| Cubans | 0.1 /100 | #295 | Tragic $73,392 |
| Haitians | 0.1 /100 | #296 | Tragic $73,306 |
| Immigrants | Mexico | 0.0 /100 | #297 | Tragic $73,160 |
| Paiute | 0.0 /100 | #298 | Tragic $72,959 |
| Indonesians | 0.0 /100 | #299 | Tragic $72,856 |
| Immigrants | Dominica | 0.0 /100 | #300 | Tragic $72,760 |
| Cherokee | 0.0 /100 | #301 | Tragic $72,682 |
| Shoshone | 0.0 /100 | #302 | Tragic $72,660 |
Demographics Similar to Immigrants from Portugal by Median Household Income
In terms of median household income, the demographic groups most similar to Immigrants from Portugal are Hawaiian ($84,729, a difference of 0.010%), Uruguayan ($84,691, a difference of 0.060%), Spaniard ($84,644, a difference of 0.11%), English ($84,915, a difference of 0.21%), and Czechoslovakian ($84,965, a difference of 0.27%).
| Demographics | Rating | Rank | Median Household Income |
| Immigrants | Cameroon | 53.4 /100 | #173 | Average $85,314 |
| Scottish | 50.0 /100 | #174 | Average $85,101 |
| Immigrants | Costa Rica | 49.2 /100 | #175 | Average $85,054 |
| Alsatians | 49.2 /100 | #176 | Average $85,053 |
| Immigrants | Eritrea | 48.8 /100 | #177 | Average $85,025 |
| Czechoslovakians | 47.8 /100 | #178 | Average $84,965 |
| English | 47.0 /100 | #179 | Average $84,915 |
| Immigrants | Portugal | 44.2 /100 | #180 | Average $84,740 |
| Hawaiians | 44.1 /100 | #181 | Average $84,729 |
| Uruguayans | 43.5 /100 | #182 | Average $84,691 |
| Spaniards | 42.7 /100 | #183 | Average $84,644 |
| Immigrants | Eastern Africa | 37.4 /100 | #184 | Fair $84,299 |
| Kenyans | 34.2 /100 | #185 | Fair $84,085 |
| Puget Sound Salish | 33.2 /100 | #186 | Fair $84,011 |
| Belgians | 33.2 /100 | #187 | Fair $84,008 |