Crow vs Danish Per Capita Income
COMPARE
Crow
Danish
Per Capita Income
Per Capita Income Comparison
Crow
Danes
$31,729
PER CAPITA INCOME
0.0/ 100
METRIC RATING
340th/ 347
METRIC RANK
$44,095
PER CAPITA INCOME
61.9/ 100
METRIC RATING
160th/ 347
METRIC RANK
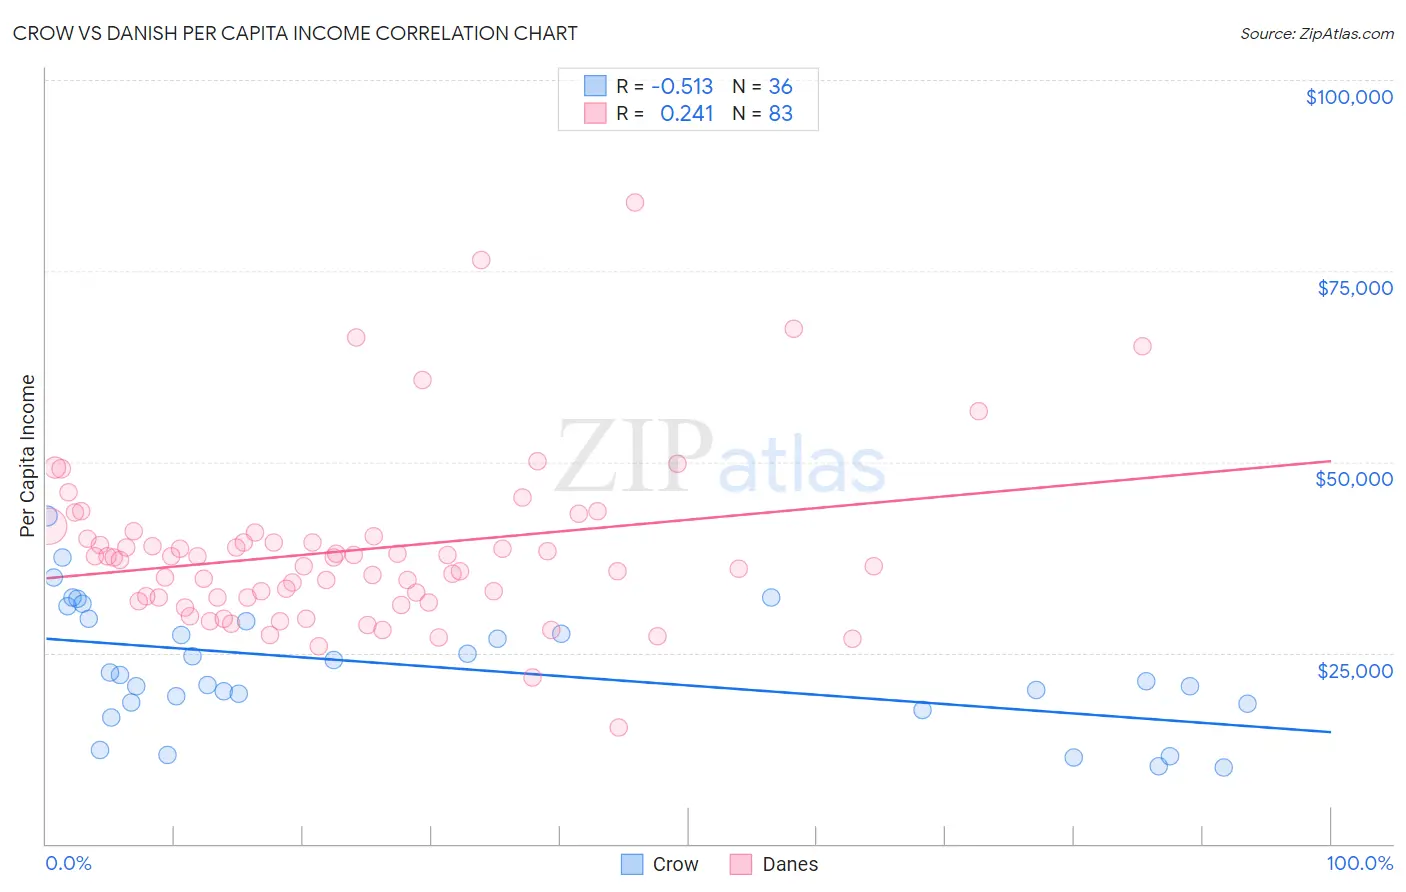
Crow vs Danish Per Capita Income Correlation Chart
The statistical analysis conducted on geographies consisting of 59,209,980 people shows a substantial negative correlation between the proportion of Crow and per capita income in the United States with a correlation coefficient (R) of -0.513 and weighted average of $31,729. Similarly, the statistical analysis conducted on geographies consisting of 474,208,442 people shows a weak positive correlation between the proportion of Danes and per capita income in the United States with a correlation coefficient (R) of 0.241 and weighted average of $44,095, a difference of 39.0%.
Per Capita Income Correlation Summary
| Measurement | Crow | Danish |
| Minimum | $9,914 | $15,232 |
| Maximum | $42,917 | $83,892 |
| Range | $33,003 | $68,660 |
| Mean | $23,129 | $38,430 |
| Median | $21,705 | $37,481 |
| Interquartile 25% (IQ1) | $18,390 | $32,272 |
| Interquartile 75% (IQ3) | $29,346 | $40,294 |
| Interquartile Range (IQR) | $10,956 | $8,022 |
| Standard Deviation (Sample) | $8,112 | $11,196 |
| Standard Deviation (Population) | $7,999 | $11,128 |
Similar Demographics by Per Capita Income
Demographics Similar to Crow by Per Capita Income
In terms of per capita income, the demographic groups most similar to Crow are Pueblo ($32,012, a difference of 0.89%), Puerto Rican ($31,268, a difference of 1.5%), Hopi ($31,177, a difference of 1.8%), Arapaho ($32,345, a difference of 1.9%), and Pima ($30,644, a difference of 3.5%).
| Demographics | Rating | Rank | Per Capita Income |
| Immigrants | Yemen | 0.0 /100 | #333 | Tragic $33,696 |
| Natives/Alaskans | 0.0 /100 | #334 | Tragic $33,279 |
| Yuman | 0.0 /100 | #335 | Tragic $33,236 |
| Yakama | 0.0 /100 | #336 | Tragic $33,009 |
| Houma | 0.0 /100 | #337 | Tragic $32,996 |
| Arapaho | 0.0 /100 | #338 | Tragic $32,345 |
| Pueblo | 0.0 /100 | #339 | Tragic $32,012 |
| Crow | 0.0 /100 | #340 | Tragic $31,729 |
| Puerto Ricans | 0.0 /100 | #341 | Tragic $31,268 |
| Hopi | 0.0 /100 | #342 | Tragic $31,177 |
| Pima | 0.0 /100 | #343 | Tragic $30,644 |
| Yup'ik | 0.0 /100 | #344 | Tragic $30,518 |
| Tohono O'odham | 0.0 /100 | #345 | Tragic $30,256 |
| Lumbee | 0.0 /100 | #346 | Tragic $29,845 |
| Navajo | 0.0 /100 | #347 | Tragic $29,031 |
Demographics Similar to Danes by Per Capita Income
In terms of per capita income, the demographic groups most similar to Danes are Costa Rican ($44,090, a difference of 0.010%), South American ($44,114, a difference of 0.040%), Swiss ($44,076, a difference of 0.040%), Immigrants from South America ($44,068, a difference of 0.060%), and Sri Lankan ($44,014, a difference of 0.18%).
| Demographics | Rating | Rank | Per Capita Income |
| Scottish | 70.6 /100 | #153 | Good $44,440 |
| Portuguese | 68.7 /100 | #154 | Good $44,362 |
| Uruguayans | 67.6 /100 | #155 | Good $44,318 |
| Slovaks | 65.4 /100 | #156 | Good $44,229 |
| South American Indians | 64.8 /100 | #157 | Good $44,206 |
| Immigrants | Nepal | 64.3 /100 | #158 | Good $44,187 |
| South Americans | 62.4 /100 | #159 | Good $44,114 |
| Danes | 61.9 /100 | #160 | Good $44,095 |
| Costa Ricans | 61.8 /100 | #161 | Good $44,090 |
| Swiss | 61.4 /100 | #162 | Good $44,076 |
| Immigrants | South America | 61.2 /100 | #163 | Good $44,068 |
| Sri Lankans | 59.8 /100 | #164 | Average $44,014 |
| Immigrants | Philippines | 59.4 /100 | #165 | Average $44,000 |
| Immigrants | Uruguay | 59.3 /100 | #166 | Average $43,997 |
| English | 58.9 /100 | #167 | Average $43,982 |