Croatian vs Immigrants from Poland Median Female Earnings
COMPARE
Croatian
Immigrants from Poland
Median Female Earnings
Median Female Earnings Comparison
Croatians
Immigrants from Poland
$40,993
MEDIAN FEMALE EARNINGS
93.7/ 100
METRIC RATING
121st/ 347
METRIC RANK
$41,630
MEDIAN FEMALE EARNINGS
98.2/ 100
METRIC RATING
102nd/ 347
METRIC RANK
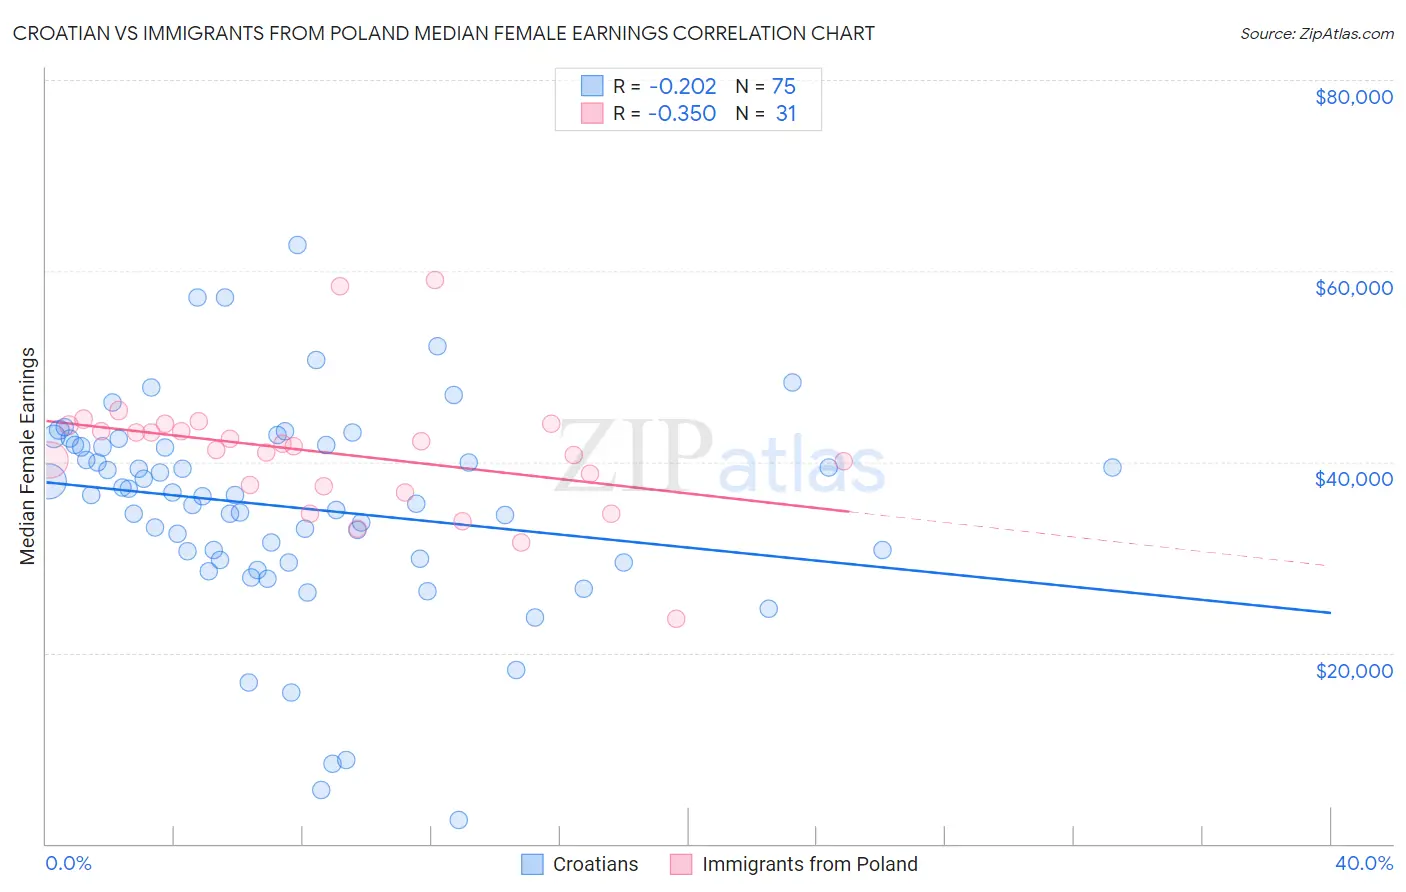
Croatian vs Immigrants from Poland Median Female Earnings Correlation Chart
The statistical analysis conducted on geographies consisting of 375,526,818 people shows a weak negative correlation between the proportion of Croatians and median female earnings in the United States with a correlation coefficient (R) of -0.202 and weighted average of $40,993. Similarly, the statistical analysis conducted on geographies consisting of 304,768,563 people shows a mild negative correlation between the proportion of Immigrants from Poland and median female earnings in the United States with a correlation coefficient (R) of -0.350 and weighted average of $41,630, a difference of 1.5%.
Median Female Earnings Correlation Summary
| Measurement | Croatian | Immigrants from Poland |
| Minimum | $2,499 | $23,547 |
| Maximum | $62,750 | $59,042 |
| Range | $60,251 | $35,495 |
| Mean | $35,223 | $40,933 |
| Median | $36,468 | $41,694 |
| Interquartile 25% (IQ1) | $29,748 | $37,434 |
| Interquartile 75% (IQ3) | $41,743 | $43,838 |
| Interquartile Range (IQR) | $11,995 | $6,404 |
| Standard Deviation (Sample) | $11,020 | $6,744 |
| Standard Deviation (Population) | $10,947 | $6,634 |
Demographics Similar to Croatians and Immigrants from Poland by Median Female Earnings
In terms of median female earnings, the demographic groups most similar to Croatians are Immigrants from Kuwait ($41,055, a difference of 0.15%), Immigrants from Philippines ($41,114, a difference of 0.30%), Immigrants from Lebanon ($41,183, a difference of 0.46%), Barbadian ($41,261, a difference of 0.65%), and Immigrants from Brazil ($41,273, a difference of 0.68%). Similarly, the demographic groups most similar to Immigrants from Poland are Immigrants from Fiji ($41,656, a difference of 0.060%), Immigrants from Argentina ($41,554, a difference of 0.18%), Immigrants from Zimbabwe ($41,527, a difference of 0.25%), Italian ($41,505, a difference of 0.30%), and Immigrants from Eritrea ($41,485, a difference of 0.35%).
| Demographics | Rating | Rank | Median Female Earnings |
| Immigrants | Fiji | 98.3 /100 | #101 | Exceptional $41,656 |
| Immigrants | Poland | 98.2 /100 | #102 | Exceptional $41,630 |
| Immigrants | Argentina | 97.9 /100 | #103 | Exceptional $41,554 |
| Immigrants | Zimbabwe | 97.8 /100 | #104 | Exceptional $41,527 |
| Italians | 97.7 /100 | #105 | Exceptional $41,505 |
| Immigrants | Eritrea | 97.6 /100 | #106 | Exceptional $41,485 |
| Palestinians | 97.6 /100 | #107 | Exceptional $41,484 |
| Jordanians | 97.5 /100 | #108 | Exceptional $41,464 |
| Chinese | 97.5 /100 | #109 | Exceptional $41,461 |
| Immigrants | Western Asia | 97.0 /100 | #110 | Exceptional $41,375 |
| Immigrants | Canada | 97.0 /100 | #111 | Exceptional $41,373 |
| Immigrants | North America | 96.7 /100 | #112 | Exceptional $41,319 |
| Macedonians | 96.4 /100 | #113 | Exceptional $41,286 |
| Immigrants | England | 96.4 /100 | #114 | Exceptional $41,277 |
| Koreans | 96.4 /100 | #115 | Exceptional $41,276 |
| Immigrants | Brazil | 96.4 /100 | #116 | Exceptional $41,273 |
| Barbadians | 96.3 /100 | #117 | Exceptional $41,261 |
| Immigrants | Lebanon | 95.6 /100 | #118 | Exceptional $41,183 |
| Immigrants | Philippines | 95.0 /100 | #119 | Exceptional $41,114 |
| Immigrants | Kuwait | 94.4 /100 | #120 | Exceptional $41,055 |
| Croatians | 93.7 /100 | #121 | Exceptional $40,993 |