Croatian vs Immigrants from North Macedonia Householder Income Ages 45 - 64 years
COMPARE
Croatian
Immigrants from North Macedonia
Householder Income Ages 45 - 64 years
Householder Income Ages 45 - 64 years Comparison
Croatians
Immigrants from North Macedonia
$108,383
HOUSEHOLDER INCOME AGES 45 - 64 YEARS
98.3/ 100
METRIC RATING
92nd/ 347
METRIC RANK
$105,892
HOUSEHOLDER INCOME AGES 45 - 64 YEARS
94.2/ 100
METRIC RATING
122nd/ 347
METRIC RANK
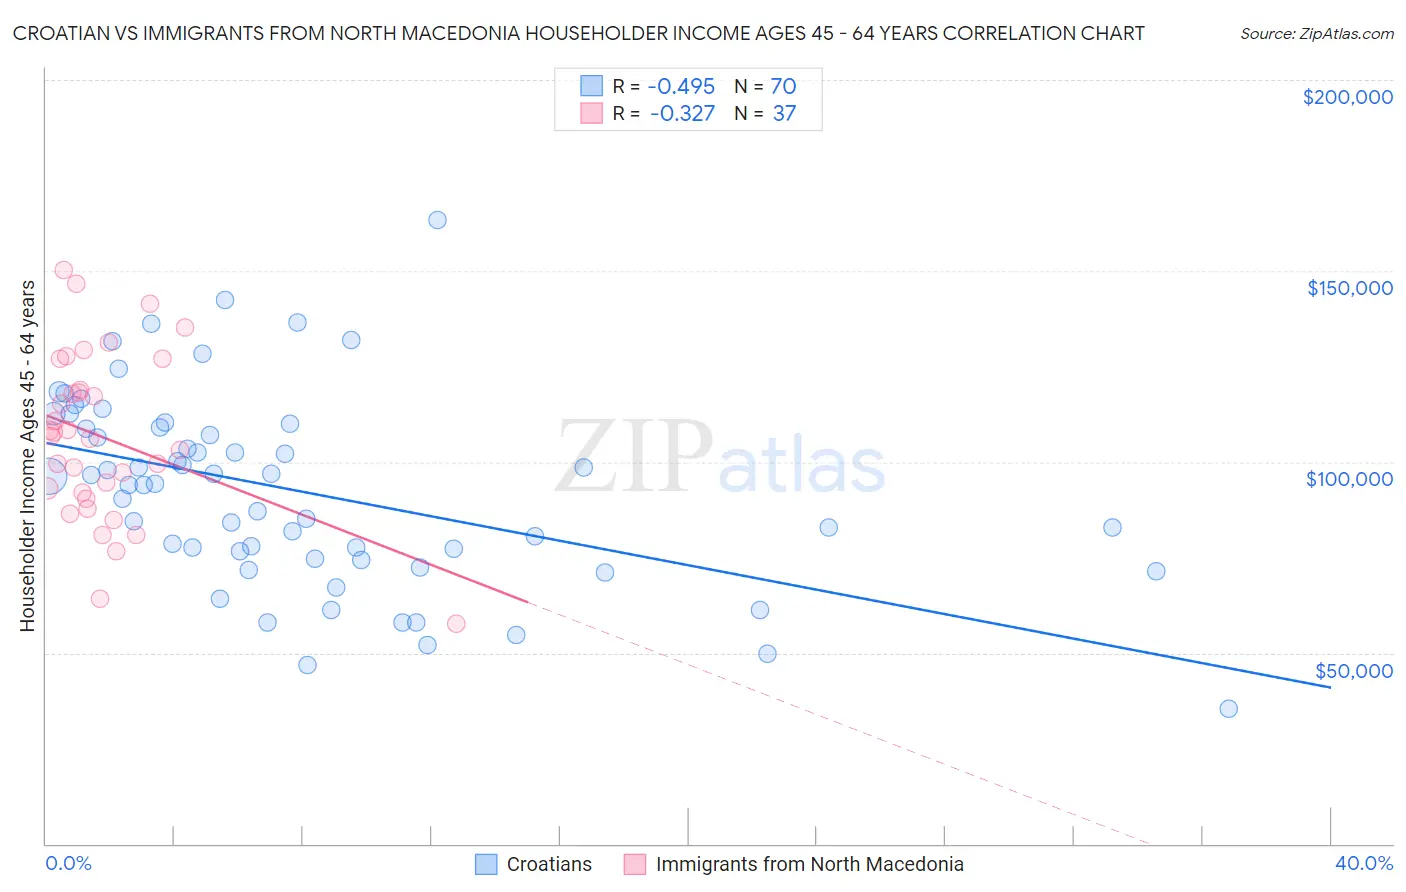
Croatian vs Immigrants from North Macedonia Householder Income Ages 45 - 64 years Correlation Chart
The statistical analysis conducted on geographies consisting of 375,164,056 people shows a moderate negative correlation between the proportion of Croatians and household income with householder between the ages 45 and 64 in the United States with a correlation coefficient (R) of -0.495 and weighted average of $108,383. Similarly, the statistical analysis conducted on geographies consisting of 74,276,475 people shows a mild negative correlation between the proportion of Immigrants from North Macedonia and household income with householder between the ages 45 and 64 in the United States with a correlation coefficient (R) of -0.327 and weighted average of $105,892, a difference of 2.4%.
Householder Income Ages 45 - 64 years Correlation Summary
| Measurement | Croatian | Immigrants from North Macedonia |
| Minimum | $35,326 | $57,692 |
| Maximum | $163,438 | $150,188 |
| Range | $128,112 | $92,496 |
| Mean | $92,198 | $106,443 |
| Median | $94,097 | $106,642 |
| Interquartile 25% (IQ1) | $74,551 | $91,237 |
| Interquartile 75% (IQ3) | $109,046 | $122,928 |
| Interquartile Range (IQR) | $34,495 | $31,692 |
| Standard Deviation (Sample) | $25,350 | $21,888 |
| Standard Deviation (Population) | $25,169 | $21,590 |
Similar Demographics by Householder Income Ages 45 - 64 years
Demographics Similar to Croatians by Householder Income Ages 45 - 64 years
In terms of householder income ages 45 - 64 years, the demographic groups most similar to Croatians are Immigrants from Croatia ($108,304, a difference of 0.070%), Ukrainian ($108,475, a difference of 0.080%), Immigrants from Philippines ($108,471, a difference of 0.080%), Immigrants from Lebanon ($108,471, a difference of 0.080%), and Sri Lankan ($108,270, a difference of 0.10%).
| Demographics | Rating | Rank | Householder Income Ages 45 - 64 years |
| Immigrants | Afghanistan | 98.6 /100 | #85 | Exceptional $108,785 |
| Austrians | 98.5 /100 | #86 | Exceptional $108,692 |
| Tongans | 98.5 /100 | #87 | Exceptional $108,643 |
| Romanians | 98.5 /100 | #88 | Exceptional $108,609 |
| Ukrainians | 98.3 /100 | #89 | Exceptional $108,475 |
| Immigrants | Philippines | 98.3 /100 | #90 | Exceptional $108,471 |
| Immigrants | Lebanon | 98.3 /100 | #91 | Exceptional $108,471 |
| Croatians | 98.3 /100 | #92 | Exceptional $108,383 |
| Immigrants | Croatia | 98.2 /100 | #93 | Exceptional $108,304 |
| Sri Lankans | 98.2 /100 | #94 | Exceptional $108,270 |
| Immigrants | Hungary | 98.2 /100 | #95 | Exceptional $108,267 |
| Immigrants | Argentina | 98.2 /100 | #96 | Exceptional $108,264 |
| Northern Europeans | 97.8 /100 | #97 | Exceptional $107,870 |
| Immigrants | Southern Europe | 97.7 /100 | #98 | Exceptional $107,775 |
| Palestinians | 97.6 /100 | #99 | Exceptional $107,721 |
Demographics Similar to Immigrants from North Macedonia by Householder Income Ages 45 - 64 years
In terms of householder income ages 45 - 64 years, the demographic groups most similar to Immigrants from North Macedonia are Polish ($105,952, a difference of 0.060%), Immigrants from South Eastern Asia ($106,109, a difference of 0.20%), Immigrants from Jordan ($106,164, a difference of 0.26%), Danish ($105,619, a difference of 0.26%), and Immigrants from Western Asia ($106,217, a difference of 0.31%).
| Demographics | Rating | Rank | Householder Income Ages 45 - 64 years |
| Immigrants | Kuwait | 95.2 /100 | #115 | Exceptional $106,285 |
| British | 95.2 /100 | #116 | Exceptional $106,264 |
| Albanians | 95.1 /100 | #117 | Exceptional $106,243 |
| Immigrants | Western Asia | 95.0 /100 | #118 | Exceptional $106,217 |
| Immigrants | Jordan | 94.9 /100 | #119 | Exceptional $106,164 |
| Immigrants | South Eastern Asia | 94.8 /100 | #120 | Exceptional $106,109 |
| Poles | 94.4 /100 | #121 | Exceptional $105,952 |
| Immigrants | North Macedonia | 94.2 /100 | #122 | Exceptional $105,892 |
| Danes | 93.4 /100 | #123 | Exceptional $105,619 |
| Immigrants | Northern Africa | 92.8 /100 | #124 | Exceptional $105,430 |
| Pakistanis | 92.4 /100 | #125 | Exceptional $105,317 |
| Portuguese | 92.4 /100 | #126 | Exceptional $105,309 |
| Immigrants | Saudi Arabia | 92.2 /100 | #127 | Exceptional $105,249 |
| Native Hawaiians | 91.8 /100 | #128 | Exceptional $105,149 |
| Peruvians | 91.5 /100 | #129 | Exceptional $105,070 |