Croatian vs Immigrants from Morocco Median Household Income
COMPARE
Croatian
Immigrants from Morocco
Median Household Income
Median Household Income Comparison
Croatians
Immigrants from Morocco
$90,685
MEDIAN HOUSEHOLD INCOME
97.3/ 100
METRIC RATING
107th/ 347
METRIC RANK
$87,930
MEDIAN HOUSEHOLD INCOME
86.0/ 100
METRIC RATING
141st/ 347
METRIC RANK
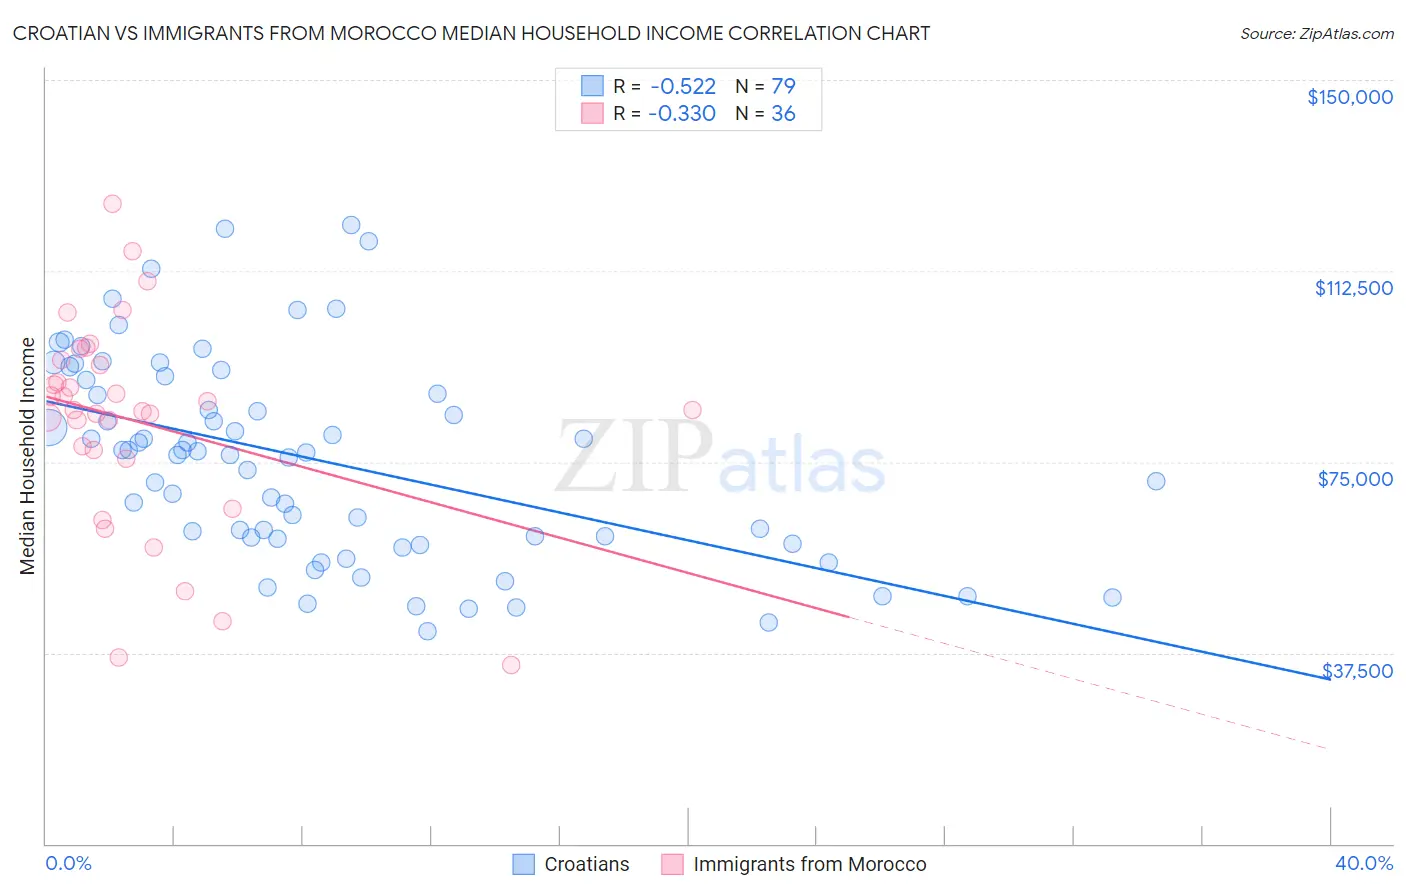
Croatian vs Immigrants from Morocco Median Household Income Correlation Chart
The statistical analysis conducted on geographies consisting of 375,471,157 people shows a substantial negative correlation between the proportion of Croatians and median household income in the United States with a correlation coefficient (R) of -0.522 and weighted average of $90,685. Similarly, the statistical analysis conducted on geographies consisting of 178,909,382 people shows a mild negative correlation between the proportion of Immigrants from Morocco and median household income in the United States with a correlation coefficient (R) of -0.330 and weighted average of $87,930, a difference of 3.1%.
Median Household Income Correlation Summary
| Measurement | Croatian | Immigrants from Morocco |
| Minimum | $41,696 | $35,000 |
| Maximum | $121,425 | $125,707 |
| Range | $79,729 | $90,707 |
| Mean | $75,345 | $82,911 |
| Median | $76,836 | $85,268 |
| Interquartile 25% (IQ1) | $59,949 | $76,412 |
| Interquartile 75% (IQ3) | $91,012 | $94,485 |
| Interquartile Range (IQR) | $31,063 | $18,073 |
| Standard Deviation (Sample) | $19,789 | $20,524 |
| Standard Deviation (Population) | $19,663 | $20,237 |
Similar Demographics by Median Household Income
Demographics Similar to Croatians by Median Household Income
In terms of median household income, the demographic groups most similar to Croatians are Zimbabwean ($90,618, a difference of 0.070%), Macedonian ($90,761, a difference of 0.080%), Chilean ($90,605, a difference of 0.090%), Palestinian ($90,574, a difference of 0.12%), and Immigrants from Poland ($90,549, a difference of 0.15%).
| Demographics | Rating | Rank | Median Household Income |
| Ukrainians | 98.3 /100 | #100 | Exceptional $91,456 |
| Immigrants | Moldova | 98.3 /100 | #101 | Exceptional $91,446 |
| Austrians | 98.2 /100 | #102 | Exceptional $91,339 |
| Immigrants | Ukraine | 98.0 /100 | #103 | Exceptional $91,124 |
| Immigrants | Kazakhstan | 97.8 /100 | #104 | Exceptional $91,015 |
| Immigrants | Brazil | 97.7 /100 | #105 | Exceptional $90,907 |
| Macedonians | 97.4 /100 | #106 | Exceptional $90,761 |
| Croatians | 97.3 /100 | #107 | Exceptional $90,685 |
| Zimbabweans | 97.2 /100 | #108 | Exceptional $90,618 |
| Chileans | 97.2 /100 | #109 | Exceptional $90,605 |
| Palestinians | 97.1 /100 | #110 | Exceptional $90,574 |
| Immigrants | Poland | 97.1 /100 | #111 | Exceptional $90,549 |
| Northern Europeans | 96.9 /100 | #112 | Exceptional $90,446 |
| Peruvians | 96.5 /100 | #113 | Exceptional $90,261 |
| Immigrants | Northern Africa | 95.9 /100 | #114 | Exceptional $90,026 |
Demographics Similar to Immigrants from Morocco by Median Household Income
In terms of median household income, the demographic groups most similar to Immigrants from Morocco are Lebanese ($88,091, a difference of 0.18%), Canadian ($87,769, a difference of 0.18%), Danish ($87,676, a difference of 0.29%), Serbian ($87,572, a difference of 0.41%), and Ugandan ($87,557, a difference of 0.43%).
| Demographics | Rating | Rank | Median Household Income |
| Swedes | 90.0 /100 | #134 | Exceptional $88,524 |
| Immigrants | Sierra Leone | 89.9 /100 | #135 | Excellent $88,498 |
| Poles | 89.7 /100 | #136 | Excellent $88,472 |
| Sierra Leoneans | 89.6 /100 | #137 | Excellent $88,463 |
| Arabs | 89.2 /100 | #138 | Excellent $88,398 |
| Immigrants | Chile | 89.2 /100 | #139 | Excellent $88,388 |
| Lebanese | 87.2 /100 | #140 | Excellent $88,091 |
| Immigrants | Morocco | 86.0 /100 | #141 | Excellent $87,930 |
| Canadians | 84.7 /100 | #142 | Excellent $87,769 |
| Danes | 83.9 /100 | #143 | Excellent $87,676 |
| Serbians | 83.0 /100 | #144 | Excellent $87,572 |
| Ugandans | 82.9 /100 | #145 | Excellent $87,557 |
| Immigrants | Uganda | 82.8 /100 | #146 | Excellent $87,553 |
| South American Indians | 81.8 /100 | #147 | Excellent $87,446 |
| Costa Ricans | 80.0 /100 | #148 | Excellent $87,262 |