Croatian vs Immigrants from Kenya Householder Income Under 25 years
COMPARE
Croatian
Immigrants from Kenya
Householder Income Under 25 years
Householder Income Under 25 years Comparison
Croatians
Immigrants from Kenya
$51,662
HOUSEHOLDER INCOME UNDER 25 YEARS
21.6/ 100
METRIC RATING
189th/ 347
METRIC RANK
$49,633
HOUSEHOLDER INCOME UNDER 25 YEARS
0.2/ 100
METRIC RATING
275th/ 347
METRIC RANK
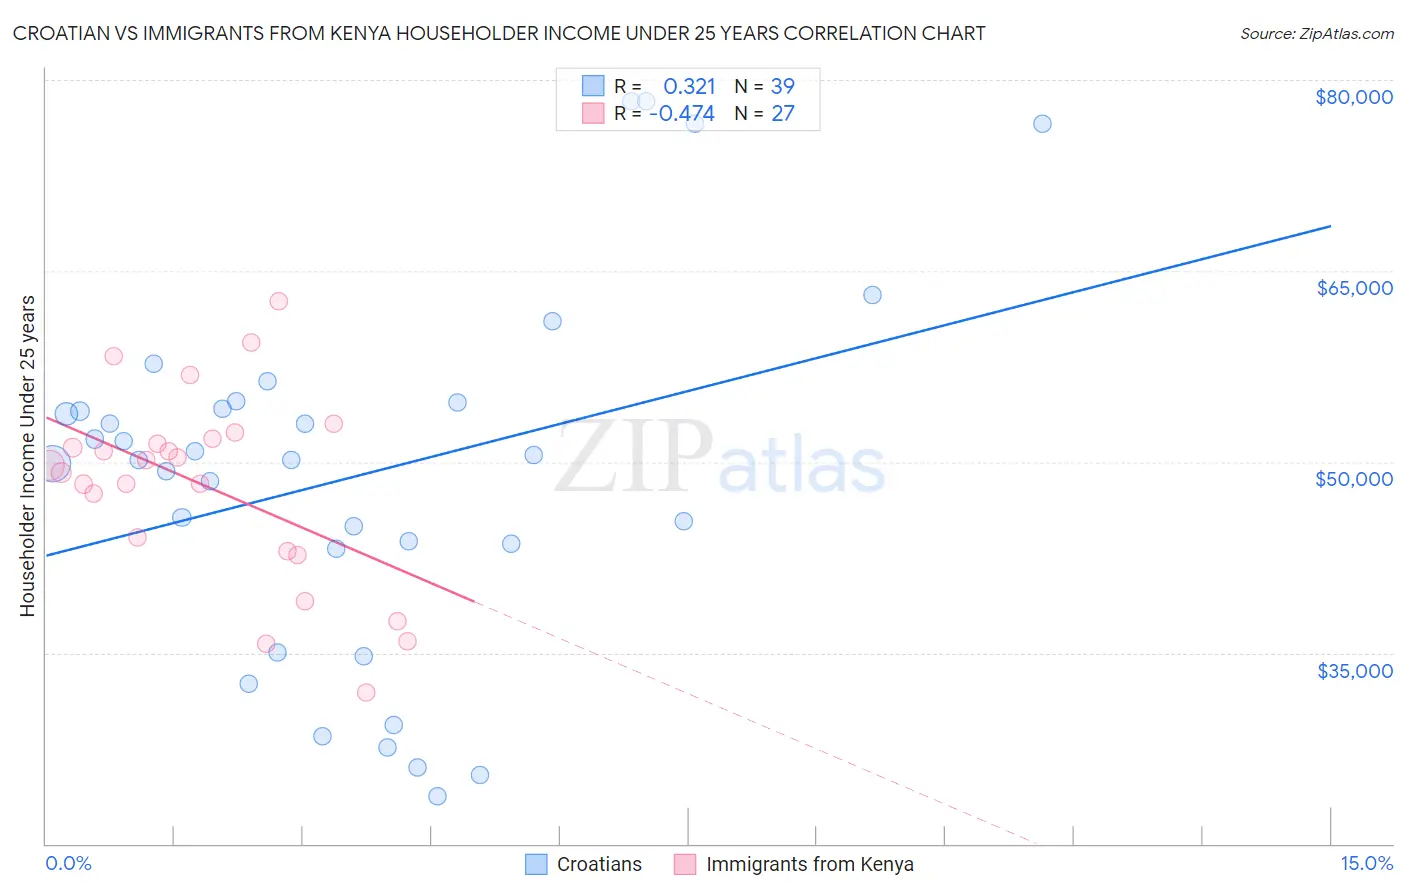
Croatian vs Immigrants from Kenya Householder Income Under 25 years Correlation Chart
The statistical analysis conducted on geographies consisting of 315,055,397 people shows a mild positive correlation between the proportion of Croatians and household income with householder under the age of 25 in the United States with a correlation coefficient (R) of 0.321 and weighted average of $51,662. Similarly, the statistical analysis conducted on geographies consisting of 195,493,950 people shows a moderate negative correlation between the proportion of Immigrants from Kenya and household income with householder under the age of 25 in the United States with a correlation coefficient (R) of -0.474 and weighted average of $49,633, a difference of 4.1%.
Householder Income Under 25 years Correlation Summary
| Measurement | Croatian | Immigrants from Kenya |
| Minimum | $23,750 | $31,849 |
| Maximum | $78,352 | $62,614 |
| Range | $54,602 | $30,765 |
| Mean | $48,905 | $48,142 |
| Median | $50,153 | $49,714 |
| Interquartile 25% (IQ1) | $43,159 | $42,964 |
| Interquartile 75% (IQ3) | $54,688 | $51,830 |
| Interquartile Range (IQR) | $11,529 | $8,867 |
| Standard Deviation (Sample) | $14,236 | $7,472 |
| Standard Deviation (Population) | $14,052 | $7,333 |
Similar Demographics by Householder Income Under 25 years
Demographics Similar to Croatians by Householder Income Under 25 years
In terms of householder income under 25 years, the demographic groups most similar to Croatians are Northern European ($51,678, a difference of 0.030%), Immigrants from South Africa ($51,705, a difference of 0.080%), Malaysian ($51,615, a difference of 0.090%), Alaskan Athabascan ($51,713, a difference of 0.10%), and Panamanian ($51,611, a difference of 0.10%).
| Demographics | Rating | Rank | Householder Income Under 25 years |
| Jordanians | 27.6 /100 | #182 | Fair $51,796 |
| Mexican American Indians | 27.0 /100 | #183 | Fair $51,783 |
| Paiute | 25.1 /100 | #184 | Fair $51,743 |
| Immigrants | Latvia | 24.8 /100 | #185 | Fair $51,737 |
| Alaskan Athabascans | 23.8 /100 | #186 | Fair $51,713 |
| Immigrants | South Africa | 23.4 /100 | #187 | Fair $51,705 |
| Northern Europeans | 22.2 /100 | #188 | Fair $51,678 |
| Croatians | 21.6 /100 | #189 | Fair $51,662 |
| Malaysians | 19.7 /100 | #190 | Poor $51,615 |
| Panamanians | 19.5 /100 | #191 | Poor $51,611 |
| West Indians | 18.5 /100 | #192 | Poor $51,583 |
| Immigrants | Eritrea | 18.1 /100 | #193 | Poor $51,574 |
| Guatemalans | 16.4 /100 | #194 | Poor $51,525 |
| Estonians | 16.4 /100 | #195 | Poor $51,523 |
| Palestinians | 16.1 /100 | #196 | Poor $51,515 |
Demographics Similar to Immigrants from Kenya by Householder Income Under 25 years
In terms of householder income under 25 years, the demographic groups most similar to Immigrants from Kenya are Dominican ($49,633, a difference of 0.0%), Immigrants from Western Africa ($49,621, a difference of 0.030%), Immigrants from Senegal ($49,742, a difference of 0.22%), Slovak ($49,753, a difference of 0.24%), and Colville ($49,774, a difference of 0.28%).
| Demographics | Rating | Rank | Householder Income Under 25 years |
| Venezuelans | 0.5 /100 | #268 | Tragic $50,011 |
| Ute | 0.5 /100 | #269 | Tragic $49,997 |
| Mexicans | 0.5 /100 | #270 | Tragic $49,989 |
| Taiwanese | 0.3 /100 | #271 | Tragic $49,804 |
| Colville | 0.3 /100 | #272 | Tragic $49,774 |
| Slovaks | 0.3 /100 | #273 | Tragic $49,753 |
| Immigrants | Senegal | 0.3 /100 | #274 | Tragic $49,742 |
| Immigrants | Kenya | 0.2 /100 | #275 | Tragic $49,633 |
| Dominicans | 0.2 /100 | #276 | Tragic $49,633 |
| Immigrants | Western Africa | 0.2 /100 | #277 | Tragic $49,621 |
| Nigerians | 0.1 /100 | #278 | Tragic $49,416 |
| Apache | 0.1 /100 | #279 | Tragic $49,395 |
| Hmong | 0.1 /100 | #280 | Tragic $49,364 |
| Immigrants | Nonimmigrants | 0.1 /100 | #281 | Tragic $49,348 |
| Alsatians | 0.1 /100 | #282 | Tragic $49,267 |