Cree vs Danish Householder Income Under 25 years
COMPARE
Cree
Danish
Householder Income Under 25 years
Householder Income Under 25 years Comparison
Cree
Danes
$48,514
HOUSEHOLDER INCOME UNDER 25 YEARS
0.0/ 100
METRIC RATING
297th/ 347
METRIC RANK
$53,041
HOUSEHOLDER INCOME UNDER 25 YEARS
88.9/ 100
METRIC RATING
141st/ 347
METRIC RANK
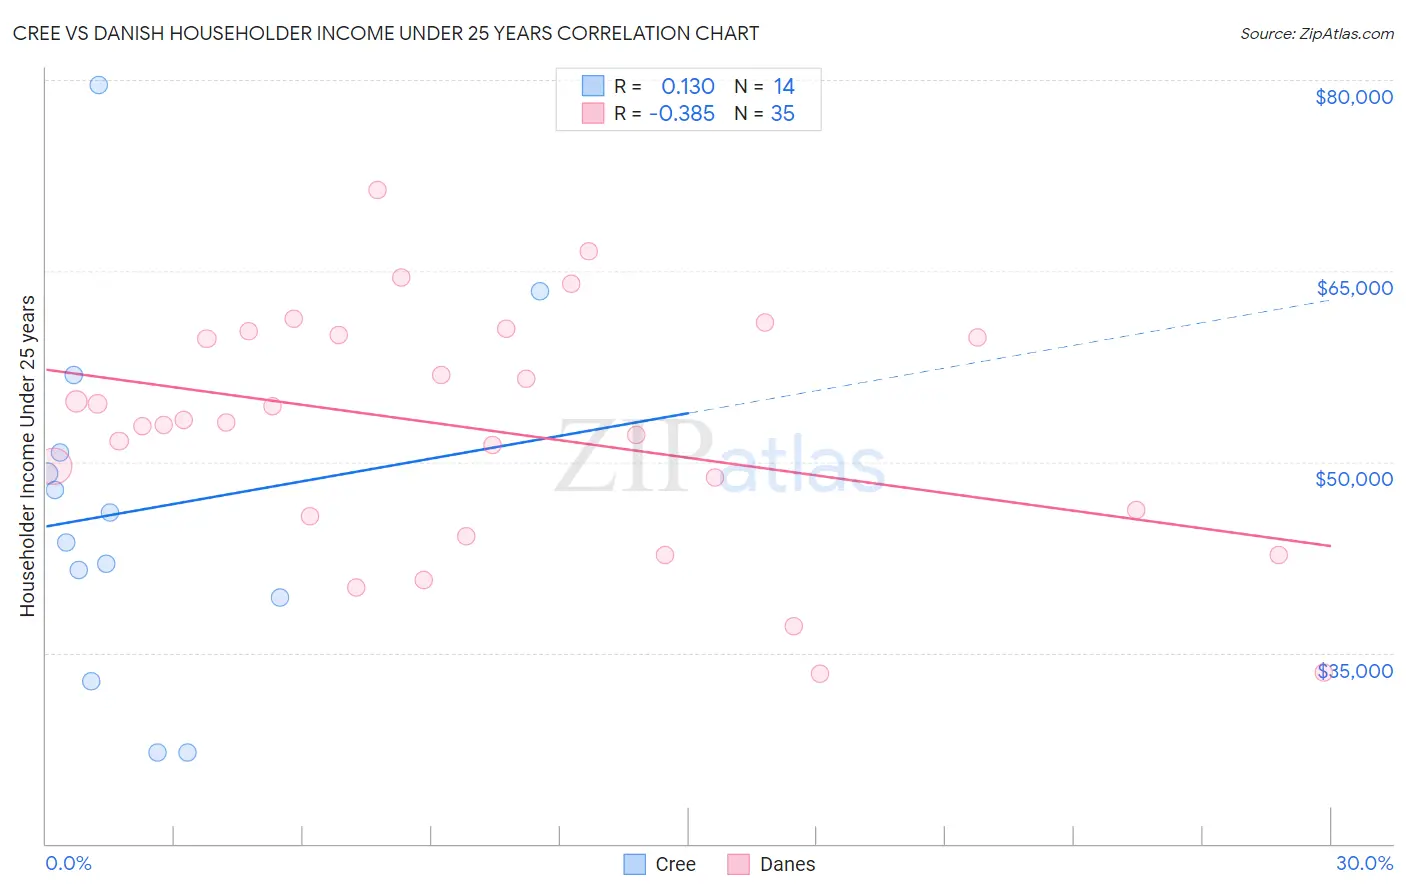
Cree vs Danish Householder Income Under 25 years Correlation Chart
The statistical analysis conducted on geographies consisting of 72,438,139 people shows a poor positive correlation between the proportion of Cree and household income with householder under the age of 25 in the United States with a correlation coefficient (R) of 0.130 and weighted average of $48,514. Similarly, the statistical analysis conducted on geographies consisting of 385,598,652 people shows a mild negative correlation between the proportion of Danes and household income with householder under the age of 25 in the United States with a correlation coefficient (R) of -0.385 and weighted average of $53,041, a difference of 9.3%.
Householder Income Under 25 years Correlation Summary
| Measurement | Cree | Danish |
| Minimum | $27,188 | $33,393 |
| Maximum | $79,562 | $71,390 |
| Range | $52,374 | $37,997 |
| Mean | $46,221 | $52,501 |
| Median | $44,879 | $53,052 |
| Interquartile 25% (IQ1) | $39,375 | $45,744 |
| Interquartile 75% (IQ3) | $50,729 | $59,942 |
| Interquartile Range (IQR) | $11,354 | $14,198 |
| Standard Deviation (Sample) | $14,003 | $9,291 |
| Standard Deviation (Population) | $13,494 | $9,158 |
Similar Demographics by Householder Income Under 25 years
Demographics Similar to Cree by Householder Income Under 25 years
In terms of householder income under 25 years, the demographic groups most similar to Cree are Blackfeet ($48,603, a difference of 0.18%), Central American Indian ($48,643, a difference of 0.26%), Somali ($48,657, a difference of 0.29%), Subsaharan African ($48,691, a difference of 0.36%), and Shoshone ($48,720, a difference of 0.42%).
| Demographics | Rating | Rank | Householder Income Under 25 years |
| Americans | 0.0 /100 | #290 | Tragic $48,860 |
| Immigrants | Burma/Myanmar | 0.0 /100 | #291 | Tragic $48,749 |
| Shoshone | 0.0 /100 | #292 | Tragic $48,720 |
| Sub-Saharan Africans | 0.0 /100 | #293 | Tragic $48,691 |
| Somalis | 0.0 /100 | #294 | Tragic $48,657 |
| Central American Indians | 0.0 /100 | #295 | Tragic $48,643 |
| Blackfeet | 0.0 /100 | #296 | Tragic $48,603 |
| Cree | 0.0 /100 | #297 | Tragic $48,514 |
| Yaqui | 0.0 /100 | #298 | Tragic $48,300 |
| Immigrants | Honduras | 0.0 /100 | #299 | Tragic $48,267 |
| Immigrants | Somalia | 0.0 /100 | #300 | Tragic $48,135 |
| Immigrants | Kuwait | 0.0 /100 | #301 | Tragic $48,126 |
| Immigrants | Liberia | 0.0 /100 | #302 | Tragic $47,981 |
| Immigrants | Middle Africa | 0.0 /100 | #303 | Tragic $47,916 |
| Menominee | 0.0 /100 | #304 | Tragic $47,907 |
Demographics Similar to Danes by Householder Income Under 25 years
In terms of householder income under 25 years, the demographic groups most similar to Danes are Hawaiian ($53,078, a difference of 0.070%), Immigrants from Armenia ($52,986, a difference of 0.10%), Swedish ($52,986, a difference of 0.10%), Costa Rican ($53,106, a difference of 0.12%), and South American Indian ($52,979, a difference of 0.12%).
| Demographics | Rating | Rank | Householder Income Under 25 years |
| Immigrants | Northern Africa | 91.9 /100 | #134 | Exceptional $53,185 |
| Chileans | 91.9 /100 | #135 | Exceptional $53,185 |
| Armenians | 91.8 /100 | #136 | Exceptional $53,179 |
| Immigrants | Barbados | 91.5 /100 | #137 | Exceptional $53,163 |
| Norwegians | 90.8 /100 | #138 | Exceptional $53,127 |
| Costa Ricans | 90.4 /100 | #139 | Exceptional $53,106 |
| Hawaiians | 89.8 /100 | #140 | Excellent $53,078 |
| Danes | 88.9 /100 | #141 | Excellent $53,041 |
| Immigrants | Armenia | 87.5 /100 | #142 | Excellent $52,986 |
| Swedes | 87.5 /100 | #143 | Excellent $52,986 |
| South American Indians | 87.3 /100 | #144 | Excellent $52,979 |
| Immigrants | Western Europe | 86.7 /100 | #145 | Excellent $52,957 |
| Immigrants | Hungary | 81.6 /100 | #146 | Excellent $52,798 |
| Latvians | 81.0 /100 | #147 | Excellent $52,783 |
| French Canadians | 76.5 /100 | #148 | Good $52,672 |