Comanche vs Northern European Median Family Income
COMPARE
Comanche
Northern European
Median Family Income
Median Family Income Comparison
Comanche
Northern Europeans
$88,556
MEDIAN FAMILY INCOME
0.1/ 100
METRIC RATING
282nd/ 347
METRIC RANK
$110,635
MEDIAN FAMILY INCOME
98.3/ 100
METRIC RATING
90th/ 347
METRIC RANK
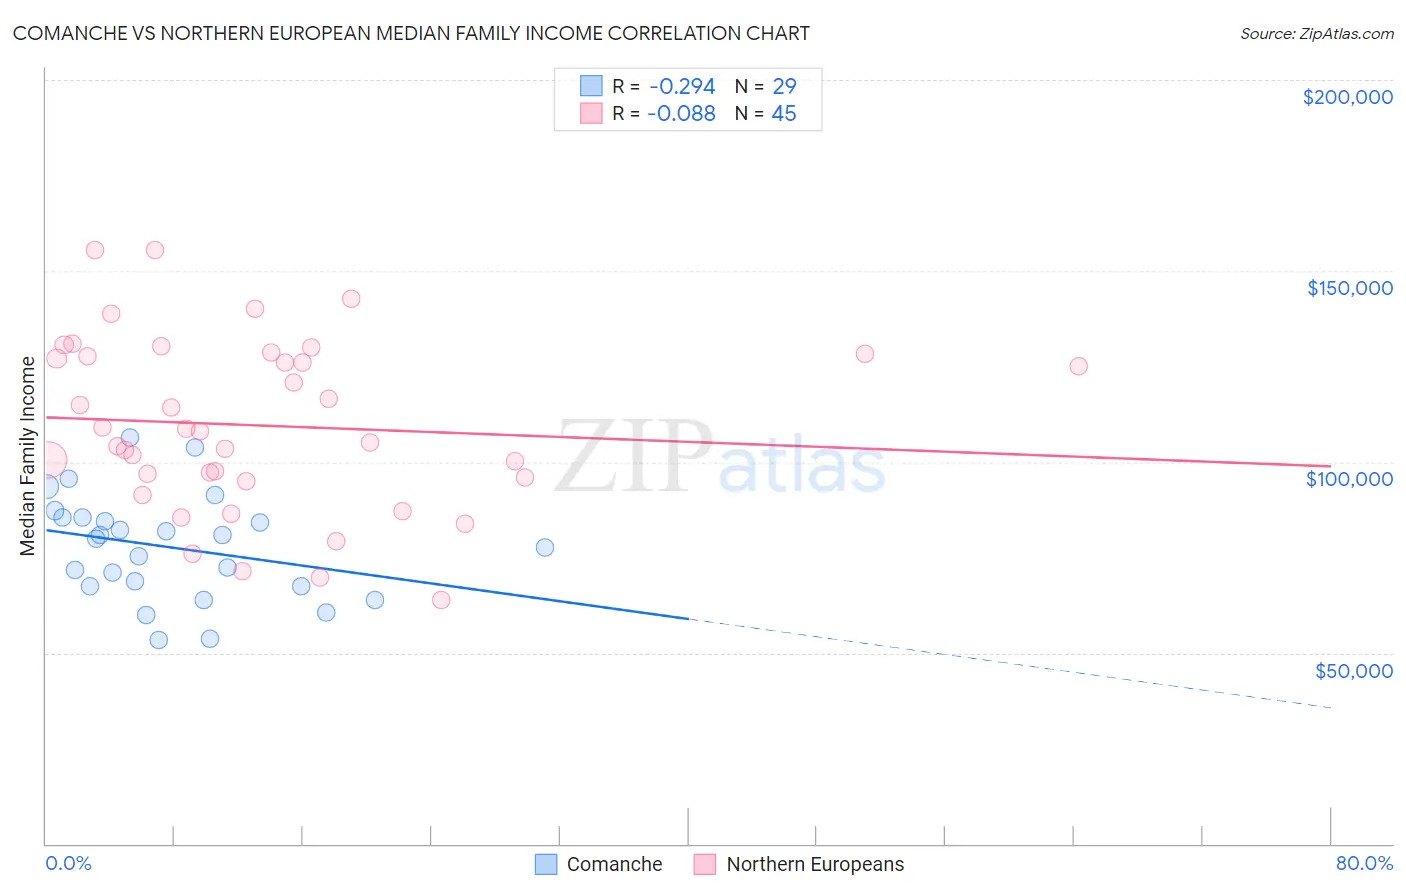
Comanche vs Northern European Median Family Income Correlation Chart
The statistical analysis conducted on geographies consisting of 109,751,078 people shows a weak negative correlation between the proportion of Comanche and median family income in the United States with a correlation coefficient (R) of -0.294 and weighted average of $88,556. Similarly, the statistical analysis conducted on geographies consisting of 405,831,688 people shows a slight negative correlation between the proportion of Northern Europeans and median family income in the United States with a correlation coefficient (R) of -0.088 and weighted average of $110,635, a difference of 24.9%.
Median Family Income Correlation Summary
| Measurement | Comanche | Northern European |
| Minimum | $53,472 | $63,831 |
| Maximum | $106,375 | $155,510 |
| Range | $52,903 | $91,679 |
| Mean | $77,578 | $109,529 |
| Median | $79,900 | $108,010 |
| Interquartile 25% (IQ1) | $67,370 | $95,374 |
| Interquartile 75% (IQ3) | $85,455 | $127,951 |
| Interquartile Range (IQR) | $18,086 | $32,577 |
| Standard Deviation (Sample) | $13,620 | $22,485 |
| Standard Deviation (Population) | $13,383 | $22,234 |
Similar Demographics by Median Family Income
Demographics Similar to Comanche by Median Family Income
In terms of median family income, the demographic groups most similar to Comanche are Blackfeet ($88,717, a difference of 0.18%), Bangladeshi ($88,358, a difference of 0.22%), Indonesian ($88,301, a difference of 0.29%), Guatemalan ($88,295, a difference of 0.29%), and Immigrants from Nicaragua ($88,267, a difference of 0.33%).
| Demographics | Rating | Rank | Median Family Income |
| Immigrants | St. Vincent and the Grenadines | 0.2 /100 | #275 | Tragic $90,094 |
| Immigrants | Zaire | 0.1 /100 | #276 | Tragic $89,285 |
| Immigrants | Jamaica | 0.1 /100 | #277 | Tragic $89,268 |
| Immigrants | Grenada | 0.1 /100 | #278 | Tragic $89,249 |
| Immigrants | Belize | 0.1 /100 | #279 | Tragic $89,197 |
| British West Indians | 0.1 /100 | #280 | Tragic $88,987 |
| Blackfeet | 0.1 /100 | #281 | Tragic $88,717 |
| Comanche | 0.1 /100 | #282 | Tragic $88,556 |
| Bangladeshis | 0.1 /100 | #283 | Tragic $88,358 |
| Indonesians | 0.1 /100 | #284 | Tragic $88,301 |
| Guatemalans | 0.1 /100 | #285 | Tragic $88,295 |
| Immigrants | Nicaragua | 0.1 /100 | #286 | Tragic $88,267 |
| Potawatomi | 0.1 /100 | #287 | Tragic $88,265 |
| Cherokee | 0.1 /100 | #288 | Tragic $88,209 |
| Central American Indians | 0.1 /100 | #289 | Tragic $88,034 |
Demographics Similar to Northern Europeans by Median Family Income
In terms of median family income, the demographic groups most similar to Northern Europeans are Immigrants from Southern Europe ($110,614, a difference of 0.020%), Immigrants from Argentina ($110,873, a difference of 0.21%), Immigrants from Lebanon ($110,159, a difference of 0.43%), Immigrants from Kazakhstan ($110,137, a difference of 0.45%), and Korean ($110,103, a difference of 0.48%).
| Demographics | Rating | Rank | Median Family Income |
| Immigrants | Egypt | 99.0 /100 | #83 | Exceptional $111,689 |
| Immigrants | Hungary | 98.8 /100 | #84 | Exceptional $111,378 |
| Croatians | 98.8 /100 | #85 | Exceptional $111,370 |
| Ukrainians | 98.8 /100 | #86 | Exceptional $111,368 |
| Austrians | 98.8 /100 | #87 | Exceptional $111,306 |
| Romanians | 98.8 /100 | #88 | Exceptional $111,243 |
| Immigrants | Argentina | 98.5 /100 | #89 | Exceptional $110,873 |
| Northern Europeans | 98.3 /100 | #90 | Exceptional $110,635 |
| Immigrants | Southern Europe | 98.3 /100 | #91 | Exceptional $110,614 |
| Immigrants | Lebanon | 97.9 /100 | #92 | Exceptional $110,159 |
| Immigrants | Kazakhstan | 97.8 /100 | #93 | Exceptional $110,137 |
| Koreans | 97.8 /100 | #94 | Exceptional $110,103 |
| Zimbabweans | 97.7 /100 | #95 | Exceptional $110,011 |
| Immigrants | Moldova | 97.7 /100 | #96 | Exceptional $109,975 |
| Jordanians | 97.5 /100 | #97 | Exceptional $109,865 |