Comanche vs Immigrants from Northern Europe Householder Income Under 25 years
COMPARE
Comanche
Immigrants from Northern Europe
Householder Income Under 25 years
Householder Income Under 25 years Comparison
Comanche
Immigrants from Northern Europe
$47,518
HOUSEHOLDER INCOME UNDER 25 YEARS
0.0/ 100
METRIC RATING
308th/ 347
METRIC RANK
$54,571
HOUSEHOLDER INCOME UNDER 25 YEARS
99.7/ 100
METRIC RATING
72nd/ 347
METRIC RANK
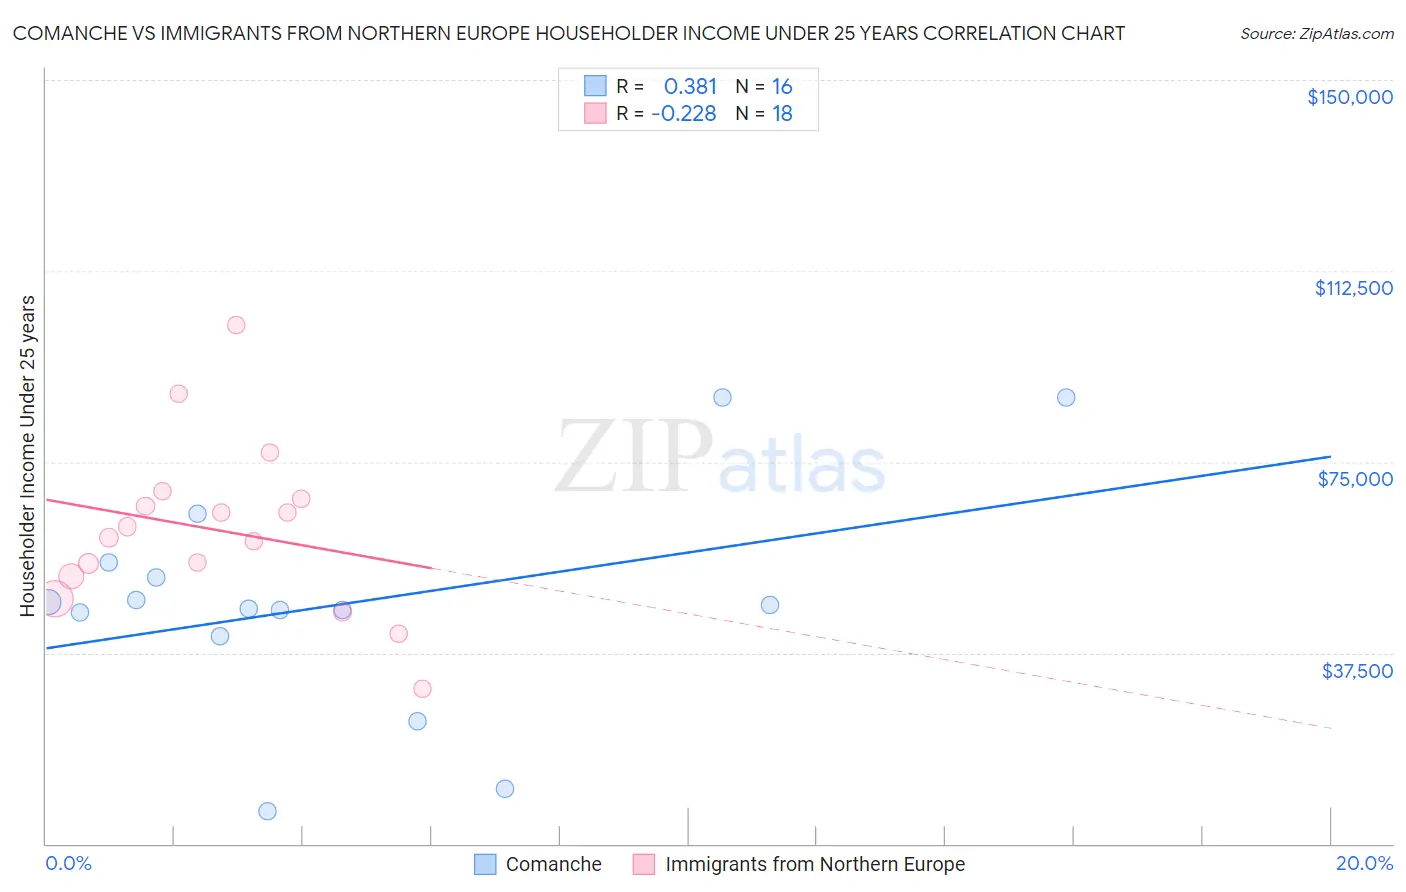
Comanche vs Immigrants from Northern Europe Householder Income Under 25 years Correlation Chart
The statistical analysis conducted on geographies consisting of 103,551,593 people shows a mild positive correlation between the proportion of Comanche and household income with householder under the age of 25 in the United States with a correlation coefficient (R) of 0.381 and weighted average of $47,518. Similarly, the statistical analysis conducted on geographies consisting of 387,569,544 people shows a weak negative correlation between the proportion of Immigrants from Northern Europe and household income with householder under the age of 25 in the United States with a correlation coefficient (R) of -0.228 and weighted average of $54,571, a difference of 14.8%.
Householder Income Under 25 years Correlation Summary
| Measurement | Comanche | Immigrants from Northern Europe |
| Minimum | $6,484 | $30,455 |
| Maximum | $87,727 | $101,975 |
| Range | $81,243 | $71,520 |
| Mean | $47,234 | $61,689 |
| Median | $46,529 | $61,171 |
| Interquartile 25% (IQ1) | $43,131 | $52,438 |
| Interquartile 75% (IQ3) | $53,745 | $67,748 |
| Interquartile Range (IQR) | $10,614 | $15,310 |
| Standard Deviation (Sample) | $21,985 | $16,674 |
| Standard Deviation (Population) | $21,287 | $16,204 |
Similar Demographics by Householder Income Under 25 years
Demographics Similar to Comanche by Householder Income Under 25 years
In terms of householder income under 25 years, the demographic groups most similar to Comanche are Bangladeshi ($47,589, a difference of 0.15%), U.S. Virgin Islander ($47,448, a difference of 0.15%), Iroquois ($47,380, a difference of 0.29%), Ottawa ($47,366, a difference of 0.32%), and Bermudan ($47,359, a difference of 0.34%).
| Demographics | Rating | Rank | Householder Income Under 25 years |
| Immigrants | Kuwait | 0.0 /100 | #301 | Tragic $48,126 |
| Immigrants | Liberia | 0.0 /100 | #302 | Tragic $47,981 |
| Immigrants | Middle Africa | 0.0 /100 | #303 | Tragic $47,916 |
| Menominee | 0.0 /100 | #304 | Tragic $47,907 |
| Cherokee | 0.0 /100 | #305 | Tragic $47,848 |
| Natives/Alaskans | 0.0 /100 | #306 | Tragic $47,704 |
| Bangladeshis | 0.0 /100 | #307 | Tragic $47,589 |
| Comanche | 0.0 /100 | #308 | Tragic $47,518 |
| U.S. Virgin Islanders | 0.0 /100 | #309 | Tragic $47,448 |
| Iroquois | 0.0 /100 | #310 | Tragic $47,380 |
| Ottawa | 0.0 /100 | #311 | Tragic $47,366 |
| Bermudans | 0.0 /100 | #312 | Tragic $47,359 |
| Delaware | 0.0 /100 | #313 | Tragic $47,159 |
| Chippewa | 0.0 /100 | #314 | Tragic $47,015 |
| Crow | 0.0 /100 | #315 | Tragic $47,012 |
Demographics Similar to Immigrants from Northern Europe by Householder Income Under 25 years
In terms of householder income under 25 years, the demographic groups most similar to Immigrants from Northern Europe are Macedonian ($54,563, a difference of 0.020%), Immigrants from Morocco ($54,593, a difference of 0.040%), Immigrants from El Salvador ($54,599, a difference of 0.050%), Immigrants from Grenada ($54,538, a difference of 0.060%), and Samoan ($54,610, a difference of 0.070%).
| Demographics | Rating | Rank | Householder Income Under 25 years |
| Yup'ik | 99.8 /100 | #65 | Exceptional $54,732 |
| Immigrants | Bangladesh | 99.8 /100 | #66 | Exceptional $54,714 |
| Okinawans | 99.8 /100 | #67 | Exceptional $54,701 |
| Tsimshian | 99.8 /100 | #68 | Exceptional $54,649 |
| Samoans | 99.7 /100 | #69 | Exceptional $54,610 |
| Immigrants | El Salvador | 99.7 /100 | #70 | Exceptional $54,599 |
| Immigrants | Morocco | 99.7 /100 | #71 | Exceptional $54,593 |
| Immigrants | Northern Europe | 99.7 /100 | #72 | Exceptional $54,571 |
| Macedonians | 99.7 /100 | #73 | Exceptional $54,563 |
| Immigrants | Grenada | 99.7 /100 | #74 | Exceptional $54,538 |
| Immigrants | Sri Lanka | 99.7 /100 | #75 | Exceptional $54,512 |
| Immigrants | Brazil | 99.6 /100 | #76 | Exceptional $54,487 |
| Immigrants | Southern Europe | 99.6 /100 | #77 | Exceptional $54,484 |
| Nepalese | 99.6 /100 | #78 | Exceptional $54,472 |
| Immigrants | Italy | 99.6 /100 | #79 | Exceptional $54,449 |