Colville vs Senegalese Median Male Earnings
COMPARE
Colville
Senegalese
Median Male Earnings
Median Male Earnings Comparison
Colville
Senegalese
$48,516
MEDIAN MALE EARNINGS
0.3/ 100
METRIC RATING
274th/ 347
METRIC RANK
$49,774
MEDIAN MALE EARNINGS
1.0/ 100
METRIC RATING
254th/ 347
METRIC RANK
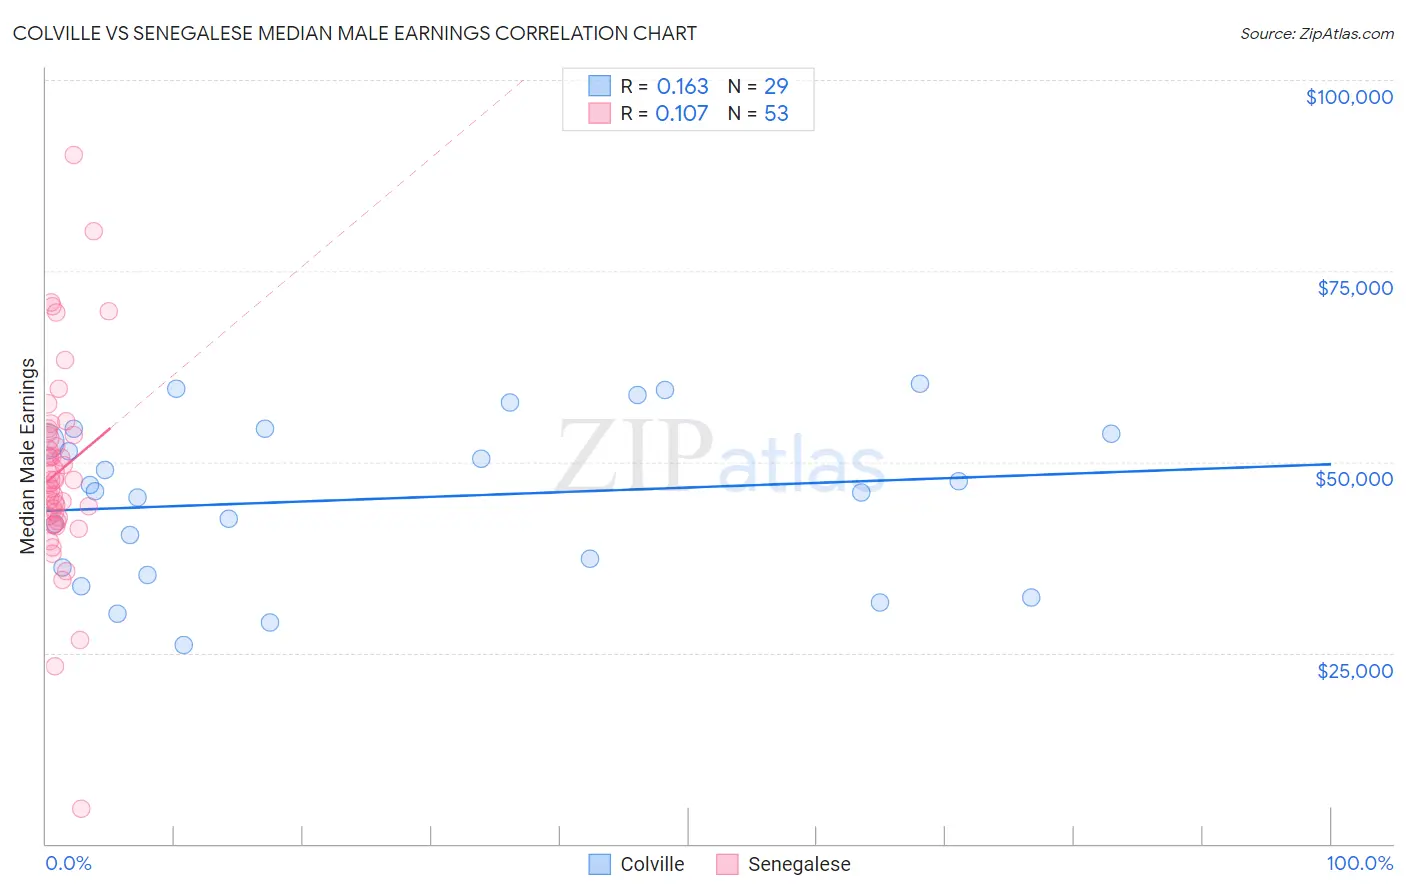
Colville vs Senegalese Median Male Earnings Correlation Chart
The statistical analysis conducted on geographies consisting of 34,680,141 people shows a poor positive correlation between the proportion of Colville and median male earnings in the United States with a correlation coefficient (R) of 0.163 and weighted average of $48,516. Similarly, the statistical analysis conducted on geographies consisting of 78,104,359 people shows a poor positive correlation between the proportion of Senegalese and median male earnings in the United States with a correlation coefficient (R) of 0.107 and weighted average of $49,774, a difference of 2.6%.
Median Male Earnings Correlation Summary
| Measurement | Colville | Senegalese |
| Minimum | $26,071 | $4,513 |
| Maximum | $60,184 | $90,259 |
| Range | $34,113 | $85,746 |
| Mean | $45,174 | $48,737 |
| Median | $46,167 | $47,653 |
| Interquartile 25% (IQ1) | $35,723 | $42,459 |
| Interquartile 75% (IQ3) | $54,047 | $53,697 |
| Interquartile Range (IQR) | $18,325 | $11,239 |
| Standard Deviation (Sample) | $10,311 | $13,453 |
| Standard Deviation (Population) | $10,132 | $13,326 |
Demographics Similar to Colville and Senegalese by Median Male Earnings
In terms of median male earnings, the demographic groups most similar to Colville are Jamaican ($48,632, a difference of 0.24%), Salvadoran ($48,646, a difference of 0.27%), Cherokee ($48,669, a difference of 0.32%), Potawatomi ($48,768, a difference of 0.52%), and Tsimshian ($48,836, a difference of 0.66%). Similarly, the demographic groups most similar to Senegalese are Alaskan Athabascan ($49,748, a difference of 0.050%), Alaska Native ($49,711, a difference of 0.13%), British West Indian ($49,636, a difference of 0.28%), Cree ($49,497, a difference of 0.56%), and Nepalese ($49,458, a difference of 0.64%).
| Demographics | Rating | Rank | Median Male Earnings |
| Senegalese | 1.0 /100 | #254 | Tragic $49,774 |
| Alaskan Athabascans | 0.9 /100 | #255 | Tragic $49,748 |
| Alaska Natives | 0.9 /100 | #256 | Tragic $49,711 |
| British West Indians | 0.8 /100 | #257 | Tragic $49,636 |
| Cree | 0.7 /100 | #258 | Tragic $49,497 |
| Nepalese | 0.7 /100 | #259 | Tragic $49,458 |
| Iroquois | 0.7 /100 | #260 | Tragic $49,374 |
| Liberians | 0.6 /100 | #261 | Tragic $49,318 |
| Immigrants | West Indies | 0.6 /100 | #262 | Tragic $49,271 |
| Nicaraguans | 0.6 /100 | #263 | Tragic $49,215 |
| Immigrants | Middle Africa | 0.6 /100 | #264 | Tragic $49,201 |
| Immigrants | Laos | 0.6 /100 | #265 | Tragic $49,190 |
| Somalis | 0.5 /100 | #266 | Tragic $49,025 |
| Spanish Americans | 0.5 /100 | #267 | Tragic $49,008 |
| Ute | 0.4 /100 | #268 | Tragic $48,899 |
| Tsimshian | 0.4 /100 | #269 | Tragic $48,836 |
| Potawatomi | 0.4 /100 | #270 | Tragic $48,768 |
| Cherokee | 0.3 /100 | #271 | Tragic $48,669 |
| Salvadorans | 0.3 /100 | #272 | Tragic $48,646 |
| Jamaicans | 0.3 /100 | #273 | Tragic $48,632 |
| Colville | 0.3 /100 | #274 | Tragic $48,516 |