Colombian vs Soviet Union Median Household Income
COMPARE
Colombian
Soviet Union
Median Household Income
Median Household Income Comparison
Colombians
Soviet Union
$85,716
MEDIAN HOUSEHOLD INCOME
59.7/ 100
METRIC RATING
169th/ 347
METRIC RANK
$95,098
MEDIAN HOUSEHOLD INCOME
99.8/ 100
METRIC RATING
58th/ 347
METRIC RANK
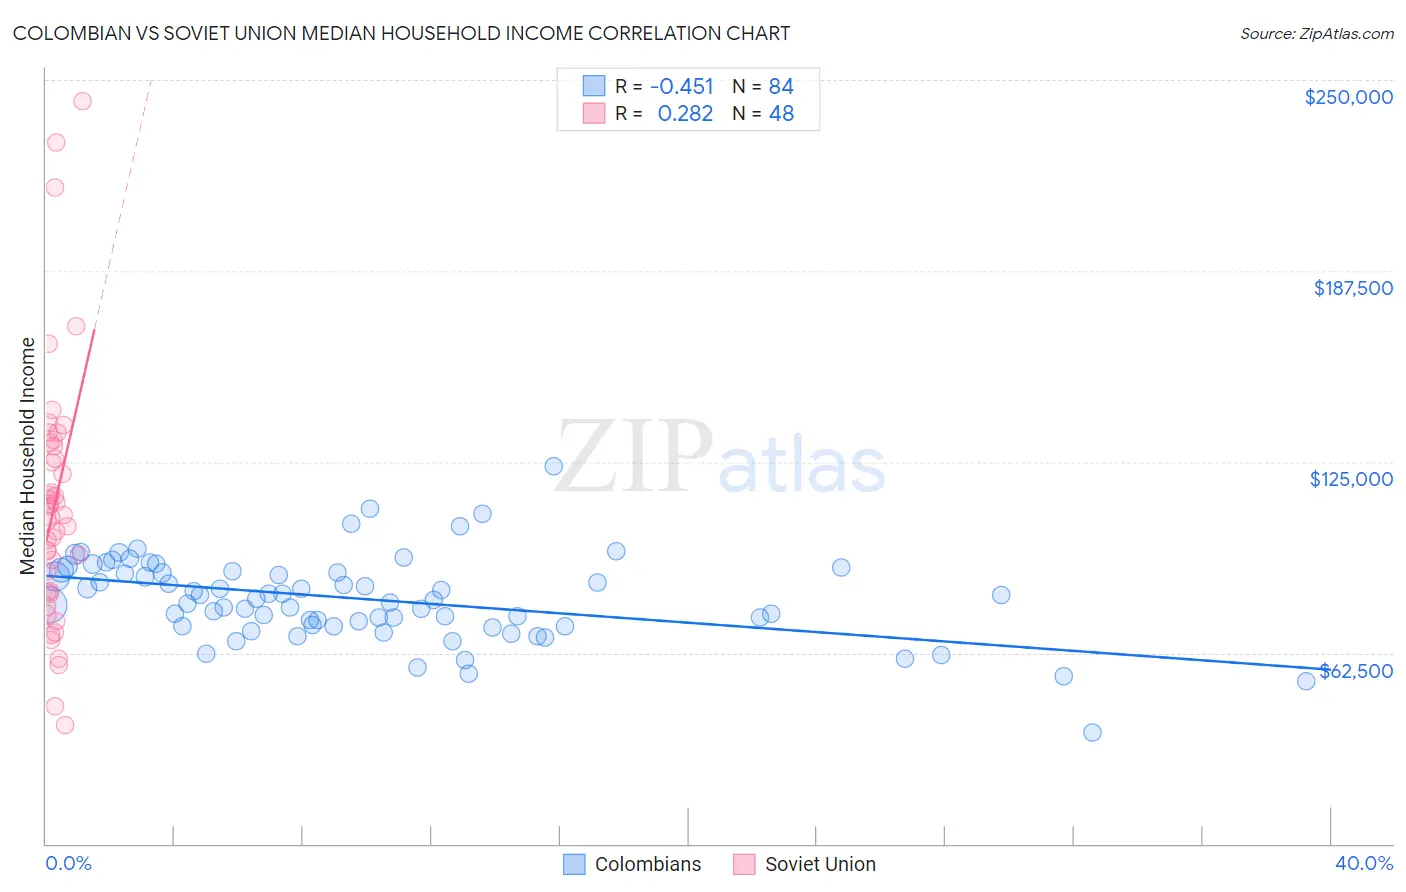
Colombian vs Soviet Union Median Household Income Correlation Chart
The statistical analysis conducted on geographies consisting of 419,147,971 people shows a moderate negative correlation between the proportion of Colombians and median household income in the United States with a correlation coefficient (R) of -0.451 and weighted average of $85,716. Similarly, the statistical analysis conducted on geographies consisting of 43,509,359 people shows a weak positive correlation between the proportion of Soviet Union and median household income in the United States with a correlation coefficient (R) of 0.282 and weighted average of $95,098, a difference of 11.0%.
Median Household Income Correlation Summary
| Measurement | Colombian | Soviet Union |
| Minimum | $36,563 | $38,670 |
| Maximum | $123,534 | $243,125 |
| Range | $86,971 | $204,455 |
| Mean | $80,109 | $111,162 |
| Median | $80,054 | $107,165 |
| Interquartile 25% (IQ1) | $71,412 | $82,608 |
| Interquartile 75% (IQ3) | $89,021 | $130,577 |
| Interquartile Range (IQR) | $17,609 | $47,969 |
| Standard Deviation (Sample) | $13,777 | $41,880 |
| Standard Deviation (Population) | $13,694 | $41,441 |
Similar Demographics by Median Household Income
Demographics Similar to Colombians by Median Household Income
In terms of median household income, the demographic groups most similar to Colombians are Swiss ($85,681, a difference of 0.040%), Icelander ($85,797, a difference of 0.090%), Immigrants ($85,818, a difference of 0.12%), Immigrants from South America ($85,611, a difference of 0.12%), and Slovene ($85,562, a difference of 0.18%).
| Demographics | Rating | Rank | Median Household Income |
| Guamanians/Chamorros | 67.7 /100 | #162 | Good $86,255 |
| Czechs | 66.4 /100 | #163 | Good $86,164 |
| Irish | 66.2 /100 | #164 | Good $86,145 |
| Norwegians | 65.3 /100 | #165 | Good $86,084 |
| Scandinavians | 65.1 /100 | #166 | Good $86,073 |
| Immigrants | Immigrants | 61.3 /100 | #167 | Good $85,818 |
| Icelanders | 61.0 /100 | #168 | Good $85,797 |
| Colombians | 59.7 /100 | #169 | Average $85,716 |
| Swiss | 59.2 /100 | #170 | Average $85,681 |
| Immigrants | South America | 58.1 /100 | #171 | Average $85,611 |
| Slovenes | 57.4 /100 | #172 | Average $85,562 |
| Immigrants | Cameroon | 53.4 /100 | #173 | Average $85,314 |
| Scottish | 50.0 /100 | #174 | Average $85,101 |
| Immigrants | Costa Rica | 49.2 /100 | #175 | Average $85,054 |
| Alsatians | 49.2 /100 | #176 | Average $85,053 |
Demographics Similar to Soviet Union by Median Household Income
In terms of median household income, the demographic groups most similar to Soviet Union are New Zealander ($95,146, a difference of 0.050%), Immigrants from Europe ($95,032, a difference of 0.070%), Korean ($95,018, a difference of 0.080%), Laotian ($94,990, a difference of 0.11%), and Immigrants from Austria ($95,277, a difference of 0.19%).
| Demographics | Rating | Rank | Median Household Income |
| Estonians | 99.9 /100 | #51 | Exceptional $95,930 |
| Immigrants | South Africa | 99.9 /100 | #52 | Exceptional $95,800 |
| Paraguayans | 99.9 /100 | #53 | Exceptional $95,737 |
| Egyptians | 99.9 /100 | #54 | Exceptional $95,673 |
| Immigrants | Czechoslovakia | 99.9 /100 | #55 | Exceptional $95,319 |
| Immigrants | Austria | 99.9 /100 | #56 | Exceptional $95,277 |
| New Zealanders | 99.8 /100 | #57 | Exceptional $95,146 |
| Soviet Union | 99.8 /100 | #58 | Exceptional $95,098 |
| Immigrants | Europe | 99.8 /100 | #59 | Exceptional $95,032 |
| Koreans | 99.8 /100 | #60 | Exceptional $95,018 |
| Laotians | 99.8 /100 | #61 | Exceptional $94,990 |
| Immigrants | Norway | 99.8 /100 | #62 | Exceptional $94,846 |
| Greeks | 99.8 /100 | #63 | Exceptional $94,735 |
| Immigrants | Netherlands | 99.7 /100 | #64 | Exceptional $94,411 |
| Immigrants | Belarus | 99.7 /100 | #65 | Exceptional $94,399 |