Choctaw vs Mexican Median Female Earnings
COMPARE
Choctaw
Mexican
Median Female Earnings
Median Female Earnings Comparison
Choctaw
Mexicans
$33,775
MEDIAN FEMALE EARNINGS
0.0/ 100
METRIC RATING
332nd/ 347
METRIC RANK
$33,664
MEDIAN FEMALE EARNINGS
0.0/ 100
METRIC RATING
333rd/ 347
METRIC RANK
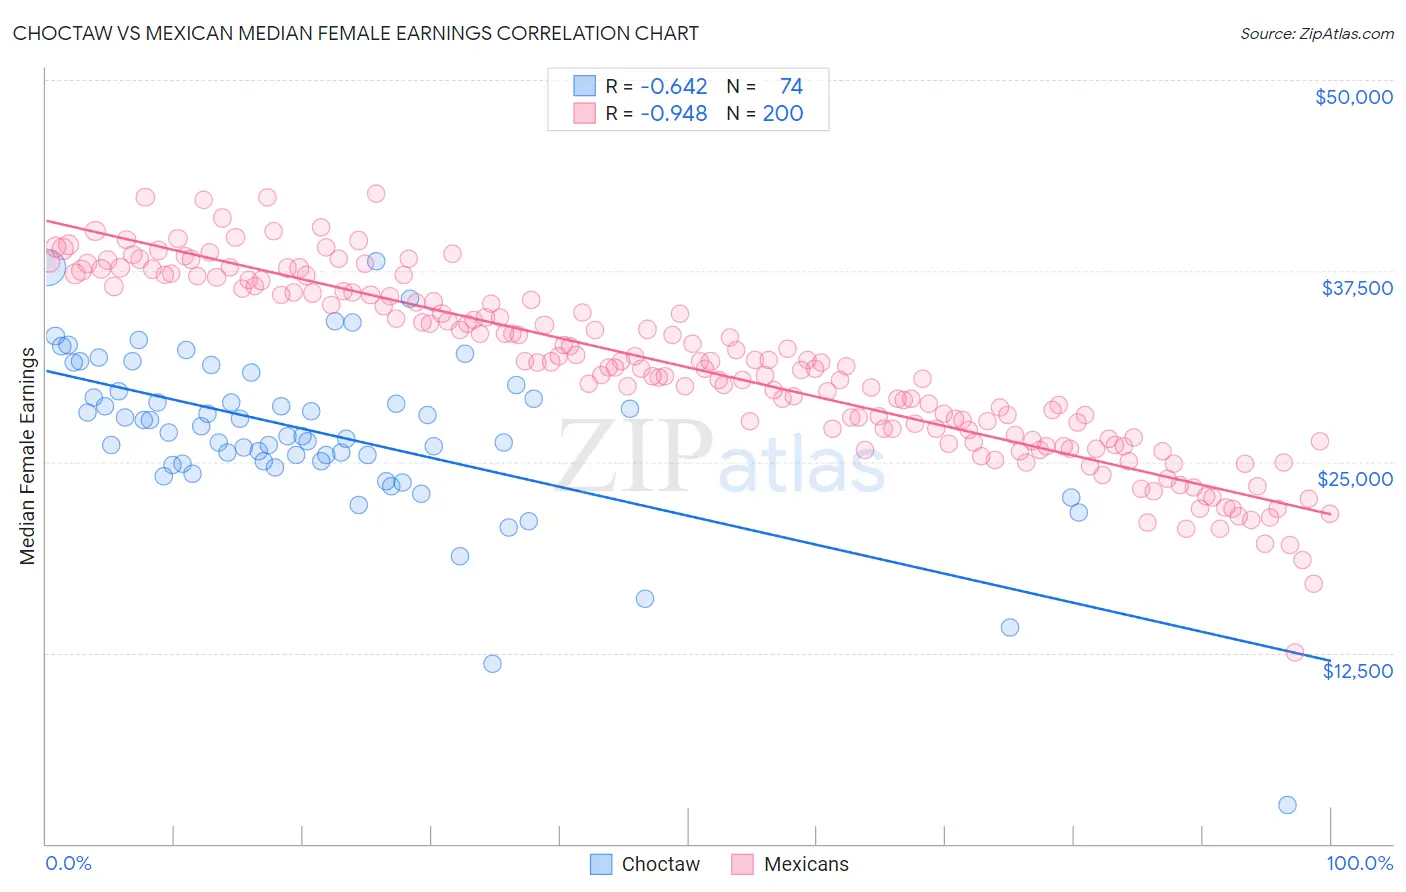
Choctaw vs Mexican Median Female Earnings Correlation Chart
The statistical analysis conducted on geographies consisting of 269,561,547 people shows a significant negative correlation between the proportion of Choctaw and median female earnings in the United States with a correlation coefficient (R) of -0.642 and weighted average of $33,775. Similarly, the statistical analysis conducted on geographies consisting of 563,682,270 people shows a near-perfect negative correlation between the proportion of Mexicans and median female earnings in the United States with a correlation coefficient (R) of -0.948 and weighted average of $33,664, a difference of 0.33%.
Median Female Earnings Correlation Summary
| Measurement | Choctaw | Mexican |
| Minimum | $2,499 | $12,526 |
| Maximum | $38,125 | $42,584 |
| Range | $35,626 | $30,058 |
| Mean | $26,859 | $31,173 |
| Median | $26,812 | $31,351 |
| Interquartile 25% (IQ1) | $24,870 | $26,695 |
| Interquartile 75% (IQ3) | $29,604 | $36,091 |
| Interquartile Range (IQR) | $4,734 | $9,396 |
| Standard Deviation (Sample) | $5,513 | $5,874 |
| Standard Deviation (Population) | $5,475 | $5,859 |
Demographics Similar to Choctaw and Mexicans by Median Female Earnings
In terms of median female earnings, the demographic groups most similar to Choctaw are Native/Alaskan ($33,806, a difference of 0.090%), Menominee ($33,894, a difference of 0.35%), Spanish American Indian ($33,625, a difference of 0.45%), Hopi ($33,932, a difference of 0.46%), and Immigrants from Central America ($33,953, a difference of 0.53%). Similarly, the demographic groups most similar to Mexicans are Spanish American Indian ($33,625, a difference of 0.12%), Native/Alaskan ($33,806, a difference of 0.42%), Creek ($33,437, a difference of 0.68%), Menominee ($33,894, a difference of 0.69%), and Hopi ($33,932, a difference of 0.80%).
| Demographics | Rating | Rank | Median Female Earnings |
| Chickasaw | 0.0 /100 | #322 | Tragic $34,414 |
| Seminole | 0.0 /100 | #323 | Tragic $34,385 |
| Immigrants | Congo | 0.0 /100 | #324 | Tragic $34,317 |
| Dutch West Indians | 0.0 /100 | #325 | Tragic $34,106 |
| Kiowa | 0.0 /100 | #326 | Tragic $34,074 |
| Cajuns | 0.0 /100 | #327 | Tragic $34,034 |
| Immigrants | Central America | 0.0 /100 | #328 | Tragic $33,953 |
| Hopi | 0.0 /100 | #329 | Tragic $33,932 |
| Menominee | 0.0 /100 | #330 | Tragic $33,894 |
| Natives/Alaskans | 0.0 /100 | #331 | Tragic $33,806 |
| Choctaw | 0.0 /100 | #332 | Tragic $33,775 |
| Mexicans | 0.0 /100 | #333 | Tragic $33,664 |
| Spanish American Indians | 0.0 /100 | #334 | Tragic $33,625 |
| Creek | 0.0 /100 | #335 | Tragic $33,437 |
| Ottawa | 0.0 /100 | #336 | Tragic $33,378 |
| Yakama | 0.0 /100 | #337 | Tragic $33,354 |
| Immigrants | Cuba | 0.0 /100 | #338 | Tragic $33,291 |
| Immigrants | Mexico | 0.0 /100 | #339 | Tragic $33,236 |
| Tohono O'odham | 0.0 /100 | #340 | Tragic $33,205 |
| Navajo | 0.0 /100 | #341 | Tragic $33,046 |
| Yup'ik | 0.0 /100 | #342 | Tragic $32,730 |